01
Lipid analysis starts with the question and the sample design
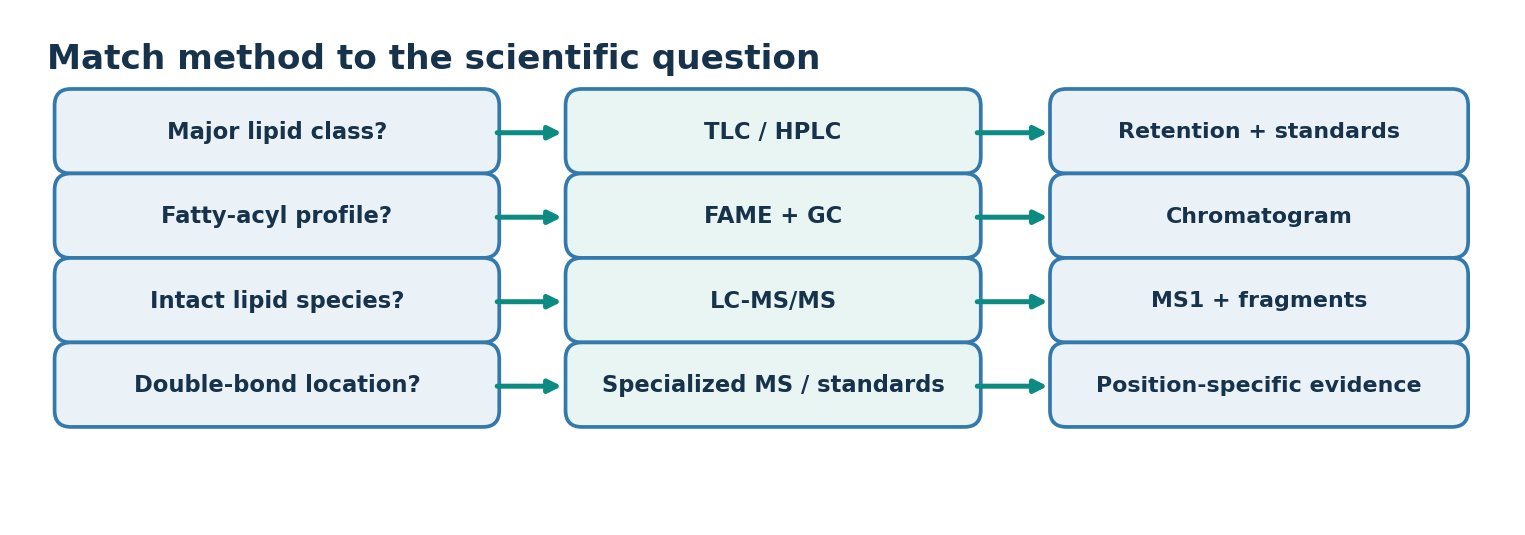
- The level of the analysis must be settled first: fatty acid composition, lipid class or molecular species
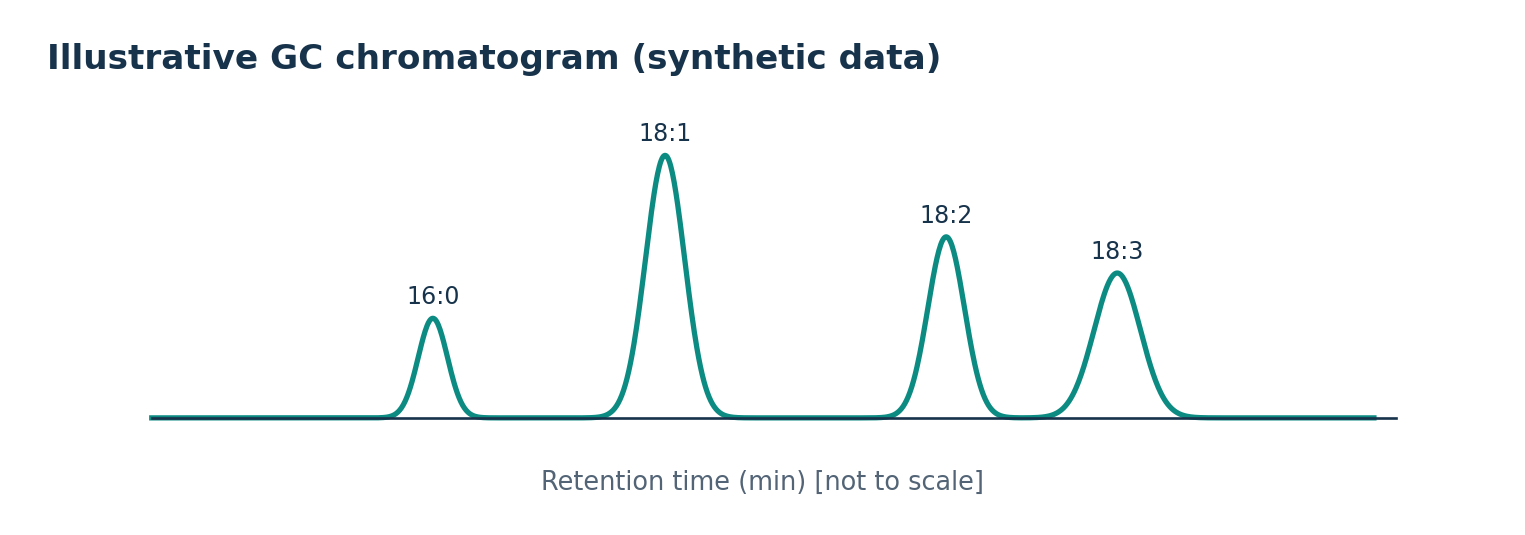
- Fatty acid ratios are addressed by FAME-GC, but class identity and sn position cannot be answered from composition alone
- That needs molecular-species LC-MS/MS or position-specific enzyme treatment
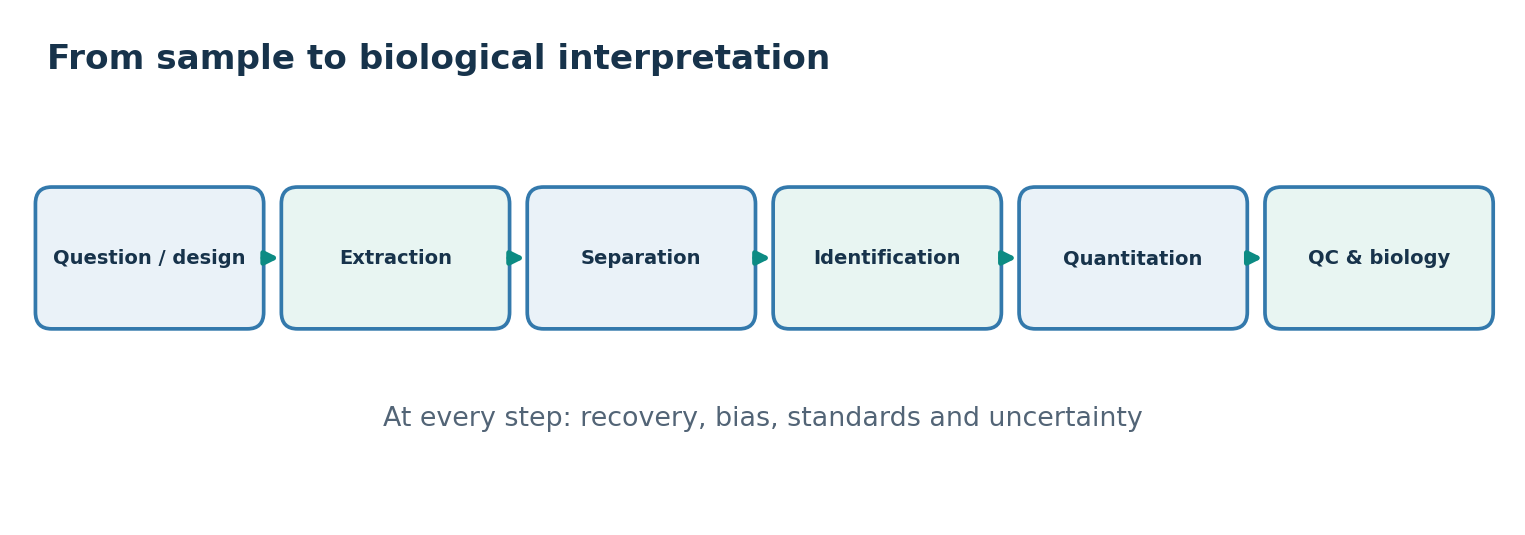
- Detection, identification and quantification are distinct stages
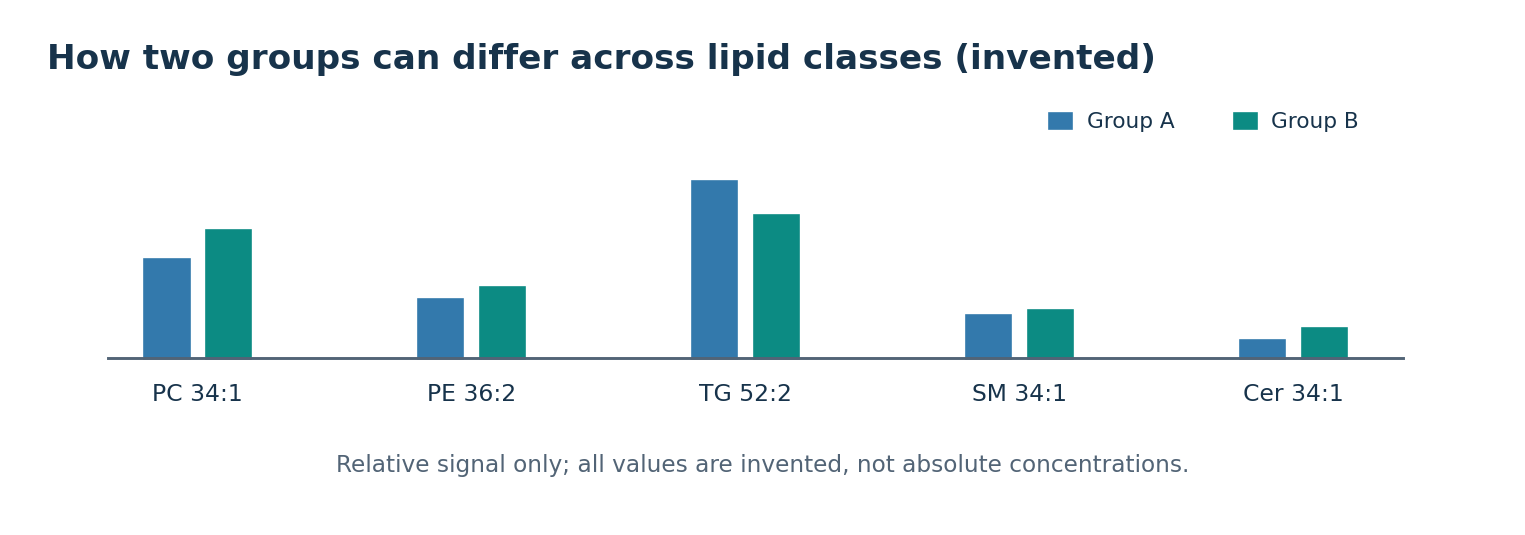
- A doubling of relative signal is not a doubling of absolute concentration
- Hydrolysis by lipases and oxidation by oxygen, light and heat begin as soon as the sample is taken
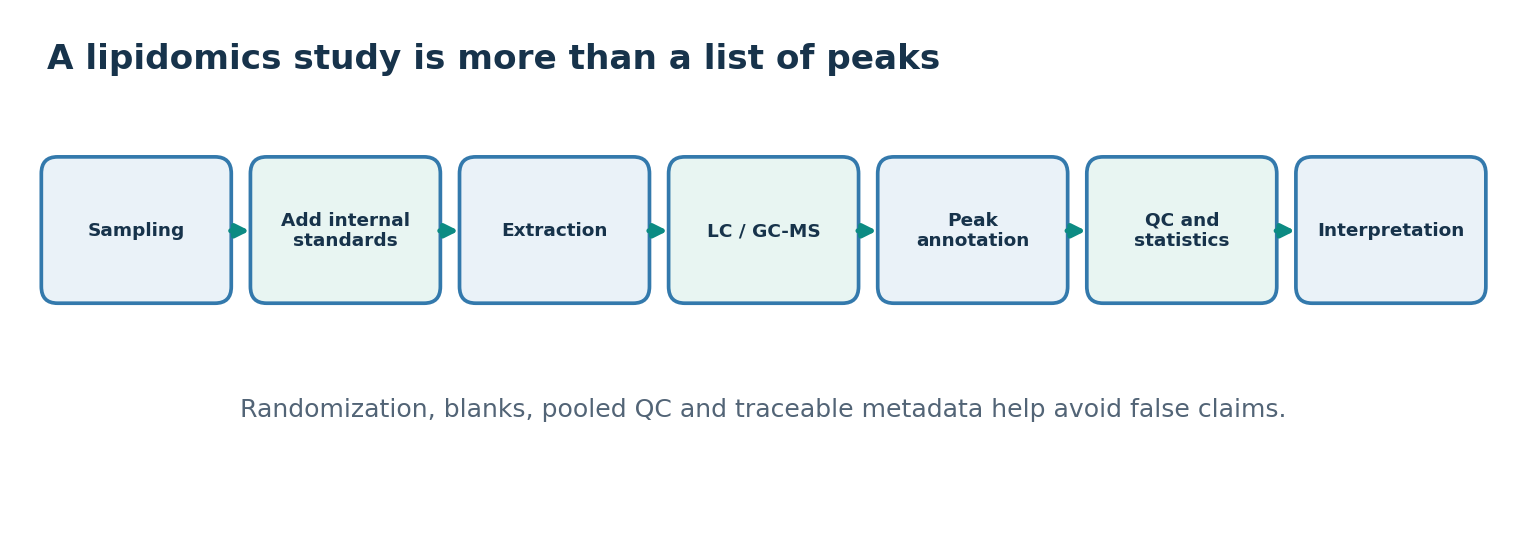
- Records should include sample mass, tissue type, storage time, freeze-thaw cycles, container material and when the internal standard was added
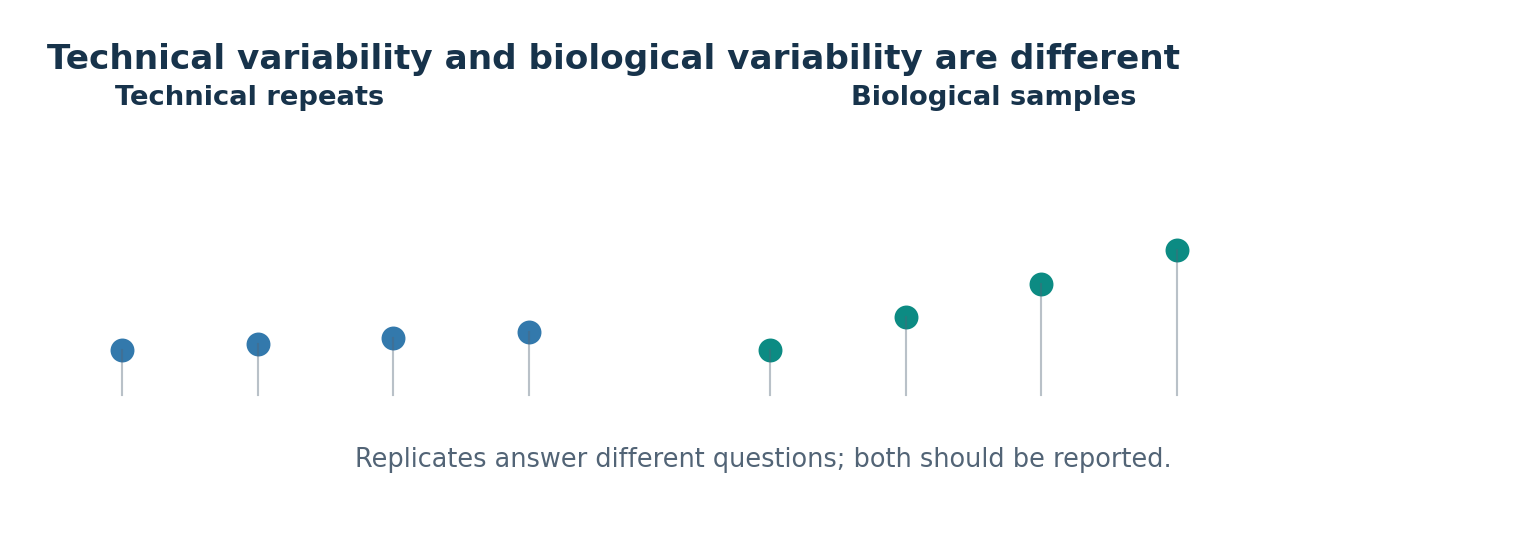
- Technical replicates assess instrument and preparation reproducibility while biological replicates capture individual variation
- Reporting technical replicates as biological replicates overstates statistical confidence
02
Lipid extraction needs organic solvents
- Most lipids are poorly soluble in water because of a large non-polar portion
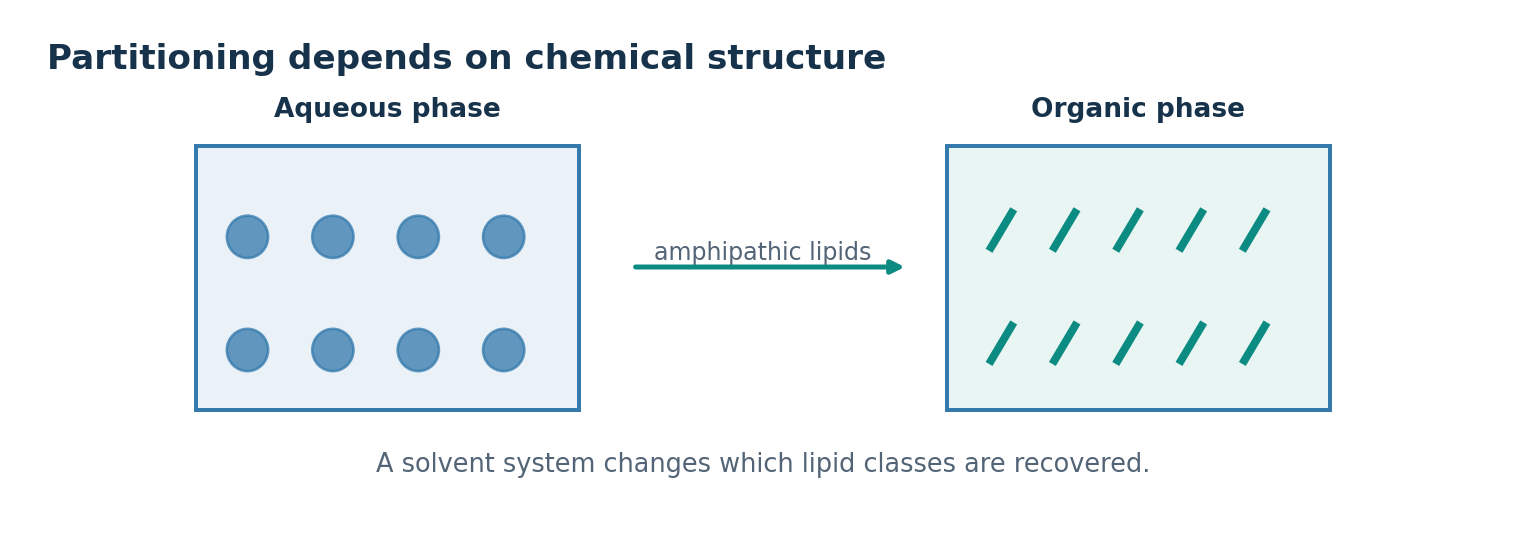
- Amphipathic lipids such as phospholipids and glycolipids interact with both water and organic solvents
- With an immiscible organic phase the partition depends on polarity, ionisation, hydrogen bonding and solvent composition
- Releasing membrane lipids bound to protein needs a combination of solvents with different properties
- The partition coefficient K as organic over aqueous concentration is a model for defined conditions, and acidic or basic lipids change charge with pH
- Recovery describes how much of the target lipid in the original sample was recovered
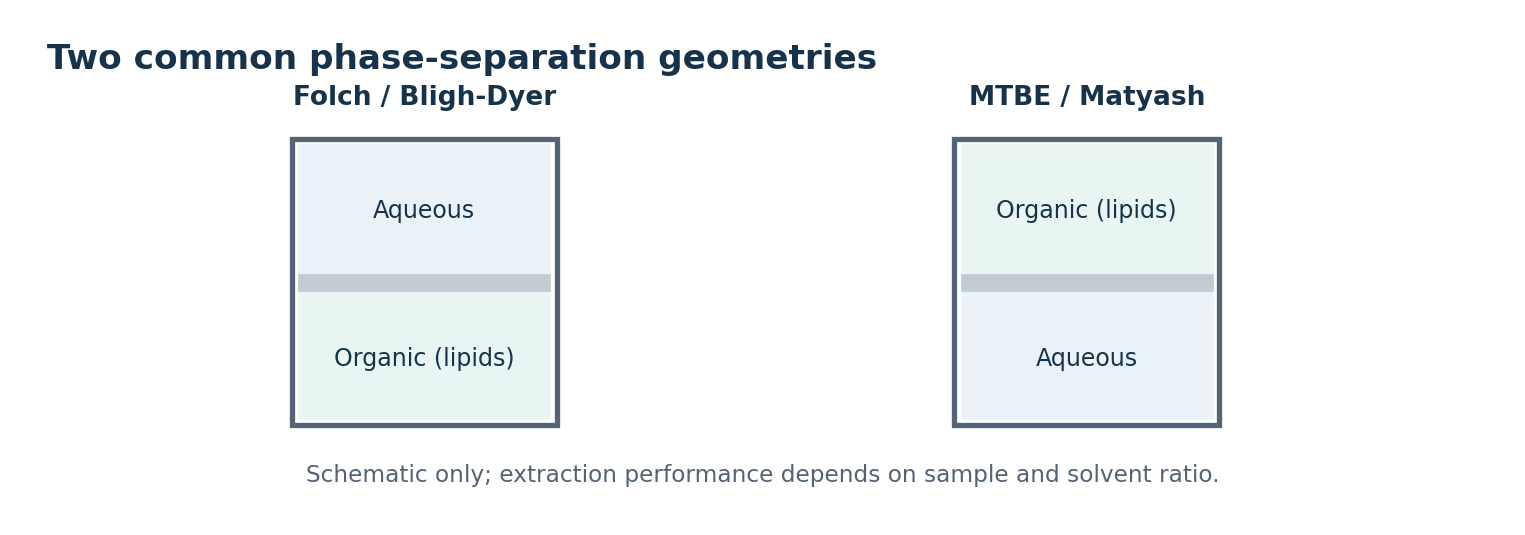
- Folch uses chloroform and methanol with the lipid-rich layer below
- Bligh-Dyer adjusts the solvent ratio for sample water
- The MTBE method of Matyash places the lipid layer on top, which favours automated collection
- An internal standard added before extraction corrects extraction losses, though it cannot correct every lipid unless recovery behaviour matches
- Example: recovering 8.2 of 10.0 nmol of a labelled lipid is 82 percent for that standard
03
Adsorption chromatography separates lipids by polarity
- Chromatography exploits different distribution between a stationary and a mobile phase
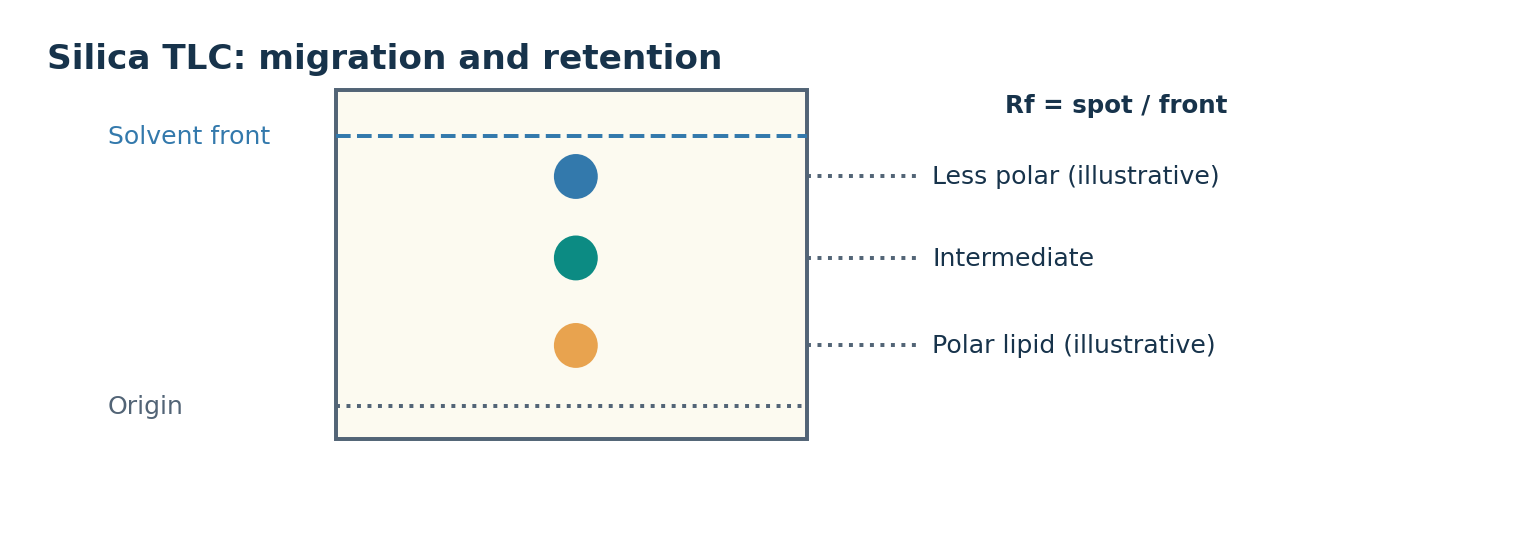
- On silica in normal-phase TLC more polar components interact strongly and move less
- Actual distance and order depend on mobile phase composition, hydrogen bonding, ionic effects and temperature
- TLC spots a mixture on a thin adsorbent layer and develops it with a rising mobile phase
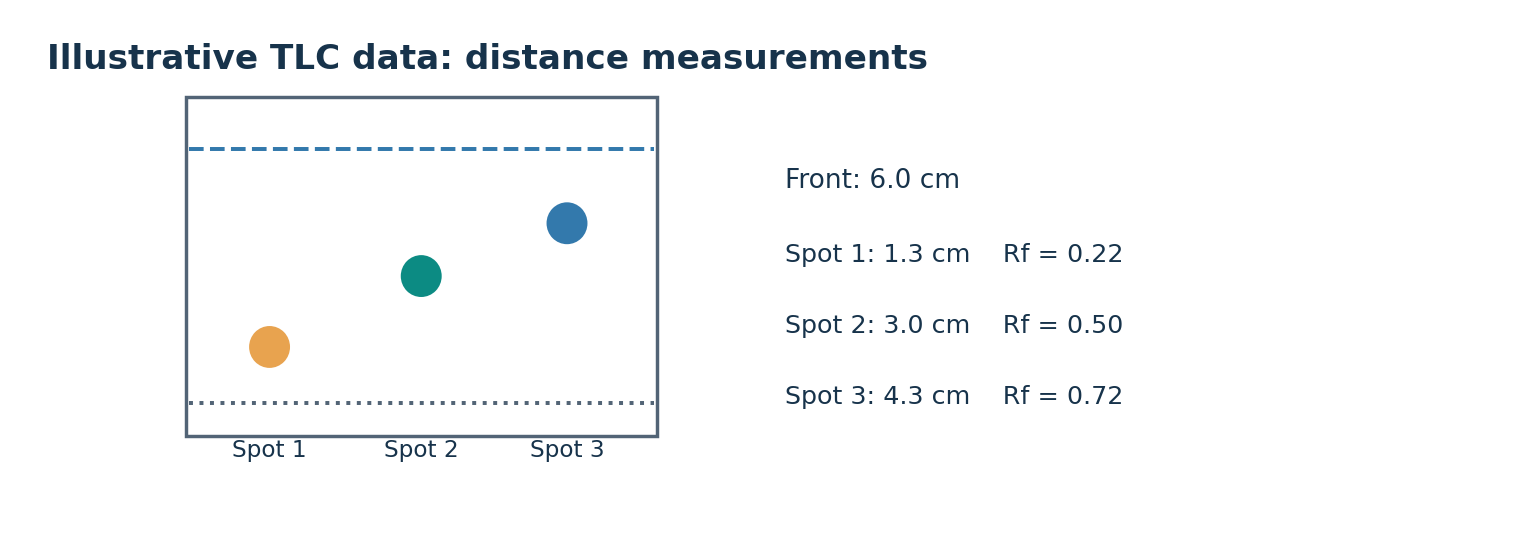
- Separated spots are compared with standards under the same conditions by distance and detection response
- An equal Rf alone does not establish chemical structure
- Rf equals spot distance divided by solvent front distance, dimensionless between zero and one
- A diffuse front or streaked spot increases uncertainty in the measurement
- HPLC pumps a liquid mobile phase through a column of small particles
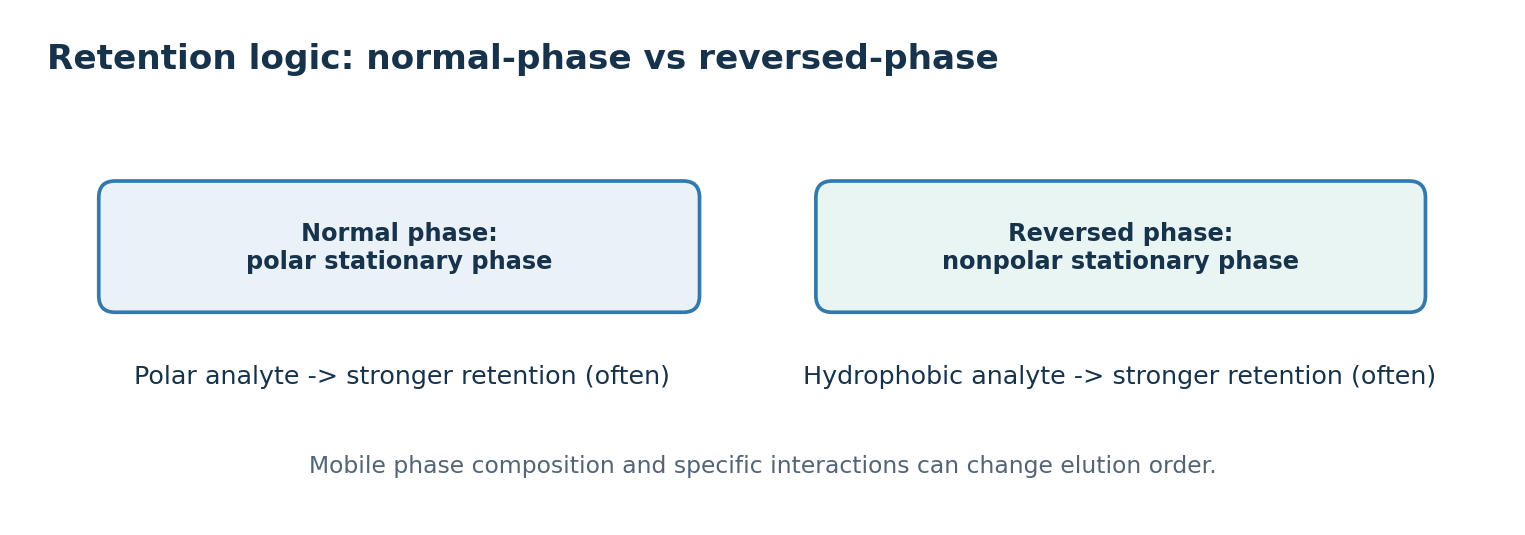
- Normal phase uses a polar stationary phase and non-polar mobile phase, while reversed phase uses hydrophobic C18-type material
- In reversed phase, chain length and unsaturation separate molecular species within a class
- Detection is a separate issue, since ordinary fatty acids lack strong chromophores and give weak UV signal
- Light scattering, charged aerosol detection or mass spectrometry reveal different lipid sets and change the detection limit and quantitation range
04
Gas chromatography analyses volatile lipid derivatives
- Gas chromatography needs the analyte to be volatile and stable under heating and carrier gas flow
- Fatty acids are awkward to analyse directly because the carboxyl group causes strong intermolecular interaction
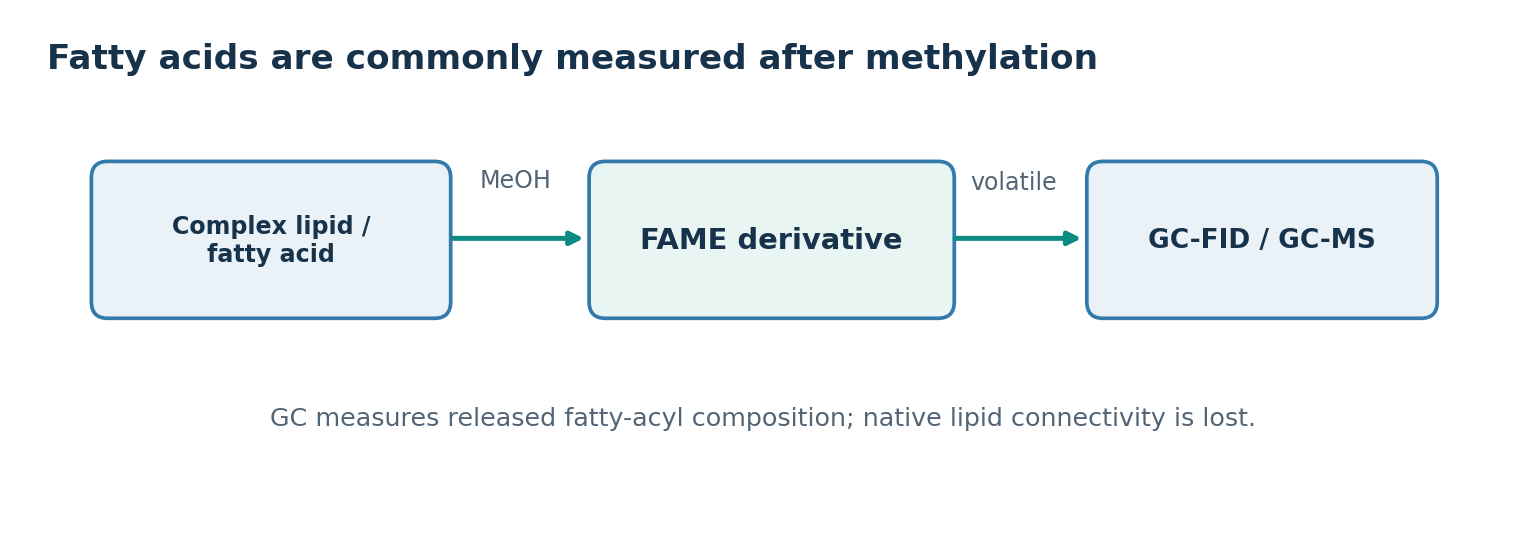
- Converting them to fatty acid methyl esters with methanol makes the analysis tractable
- For a free fatty acid, R-COOH plus methanol gives R-COOCH3 plus water
- Transesterification of a triacylglycerol gives glycerol and three FAMEs, though in practice several steps are involved
- Derivatisation mostly destroys the original lipid class and sn position information
- GC-FID uses flame ionisation for quantitation of most organic compounds
- GC-MS adds mass spectra of separated components to support identification
- Co-eluting compounds, double bond position and cis-trans isomers require careful column and standard selection
- Peak area relates to amount, but response factors differ between compounds, so uncorrected areas are only relative signals
- Example: 32 percent saturated and 68 percent unsaturated describes composition only, not which triacylglycerol contained them
05
Specific hydrolysis helps infer lipid structure
- Hydrolysis is water-dependent cleavage of a covalent bond
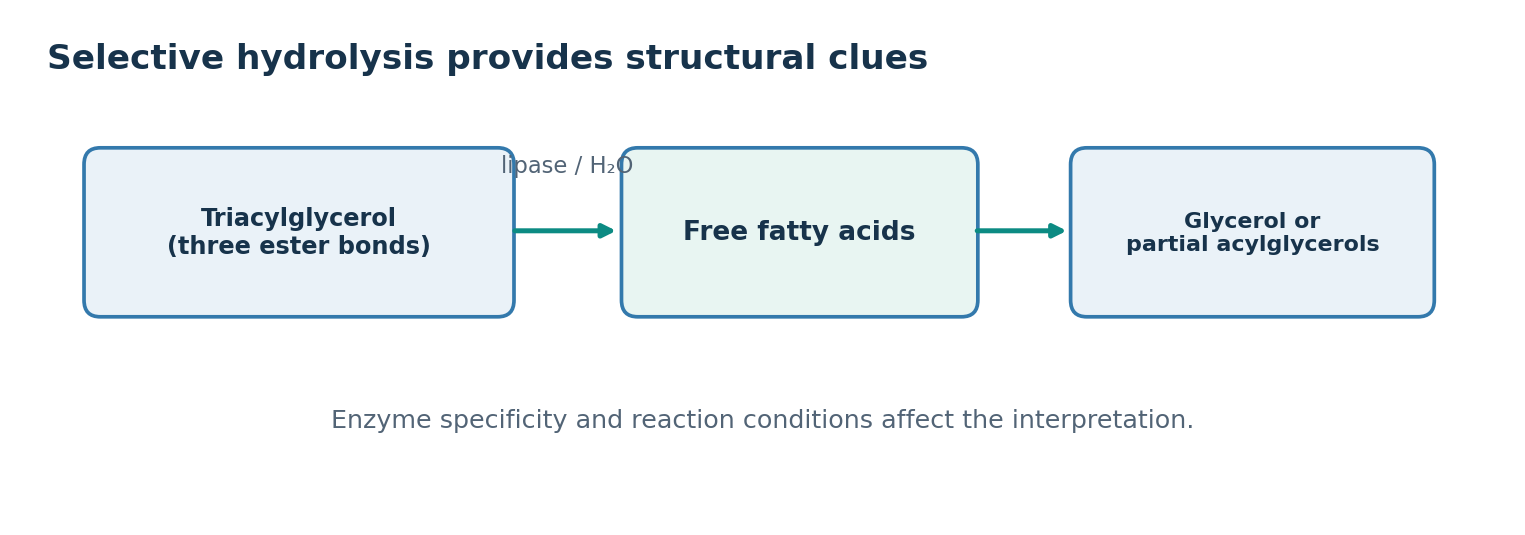
- Ester bonds can be cleaved chemically or by lipases and esterases
- Complete hydrolysis of a triacylglycerol gives one glycerol and three fatty acids
- Ceramide with its amide bond needs a different specificity such as ceramidase
- Archaeal ether lipids resist ordinary ester hydrolysis
- Some lipases act preferentially at sn-1 or sn-3
- Analysing the monoacylglycerol and fatty acids produced allows partial inference of original position
- Acyl migration or incomplete selectivity changes the interpretation
- Confirming structure requires controls, defined reaction times, standards and independent methods
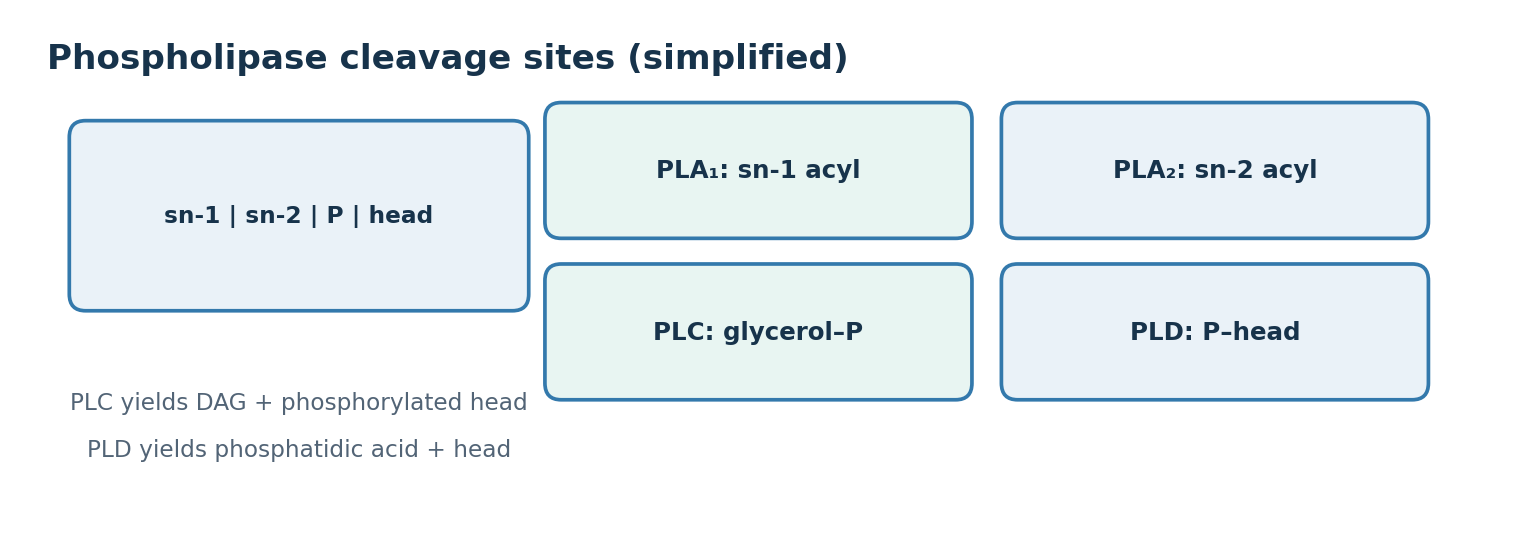
- PLA1 cleaves sn-1, PLA2 cleaves sn-2, PLC cleaves between glycerol and phosphate and PLD between phosphate and head group
- Example: DAG plus phosphocholine from phosphatidylcholine indicates PLC, while PLD gives phosphatidic acid and choline and PLA2 gives lysophospholipid and fatty acid
06
Mass spectrometry: strong structural clues and clear limits
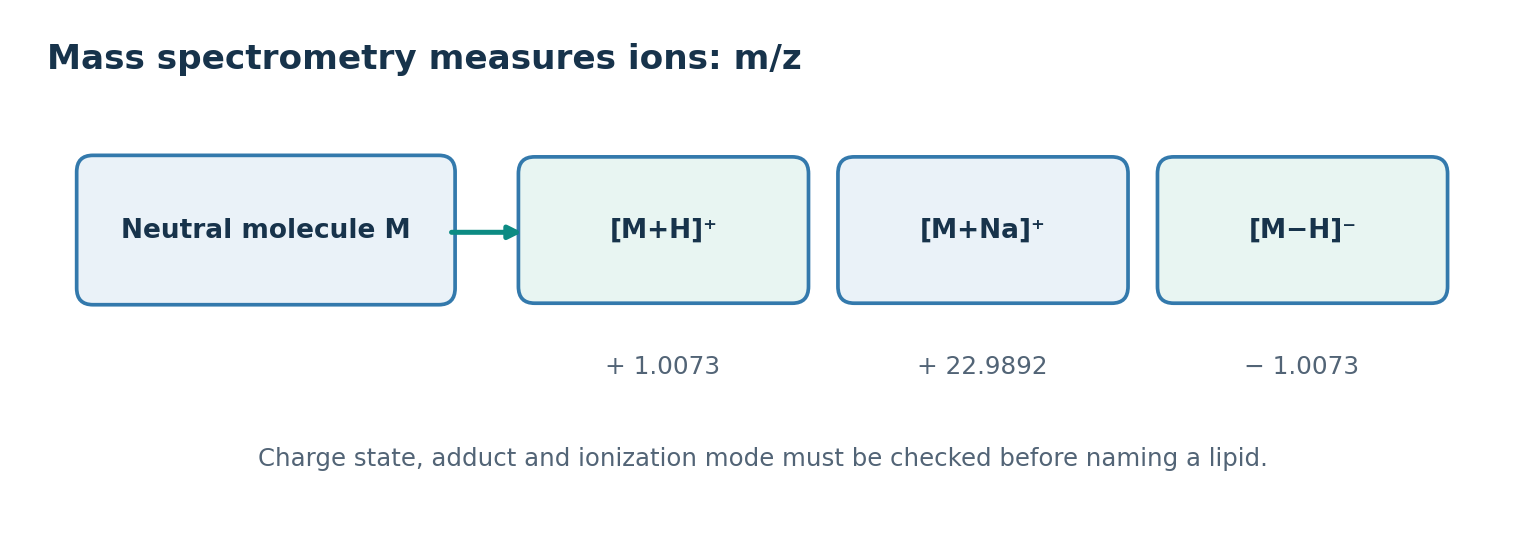
- Mass spectrometry measures m/z of gas-phase ions rather than the neutral molecular mass
- LC-MS often uses electrospray ionisation, giving M+H and M+Na in positive mode and M-H in negative mode
- One molecule can give several peaks, so adducts and charge states must be identified
- A neutral mass of 500.0000 Da gives about 501.0073 for M+H, 522.9892 for M+Na and 498.9927 for M-H
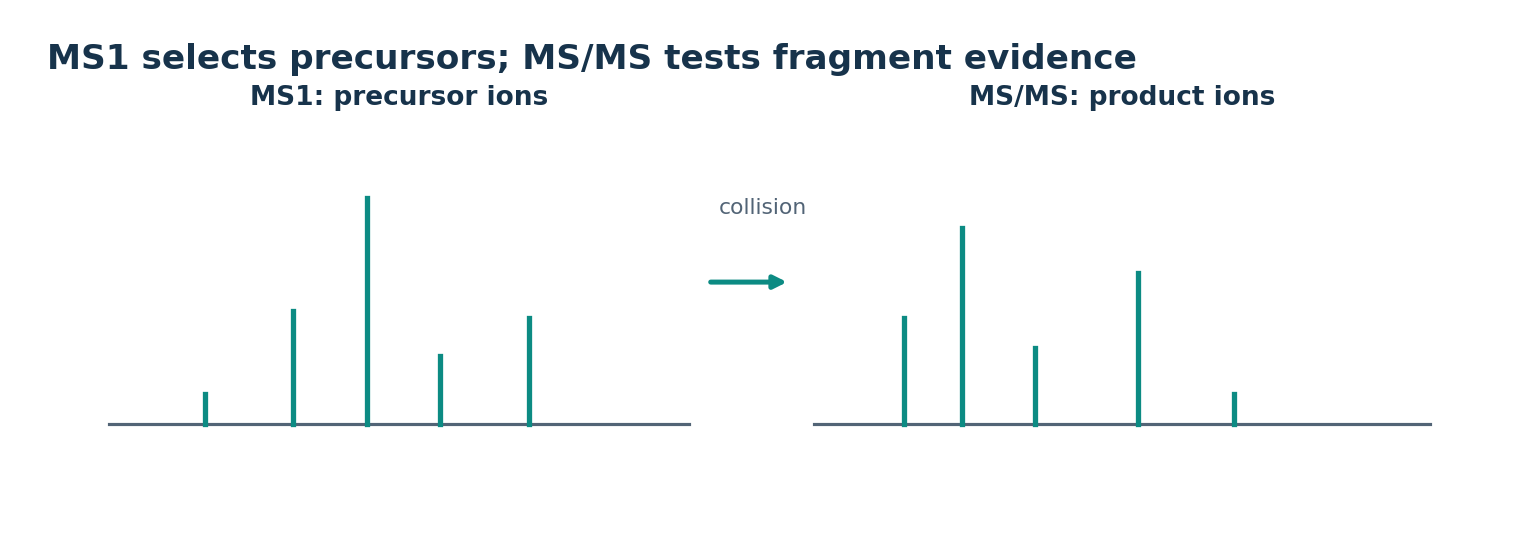
- MS/MS selects a precursor ion, fragments it and records product ions
- Diagnostic fragments of phospholipid head groups and acyl fragments report class and chain information
- Not every structural isomer is resolved under the same conditions
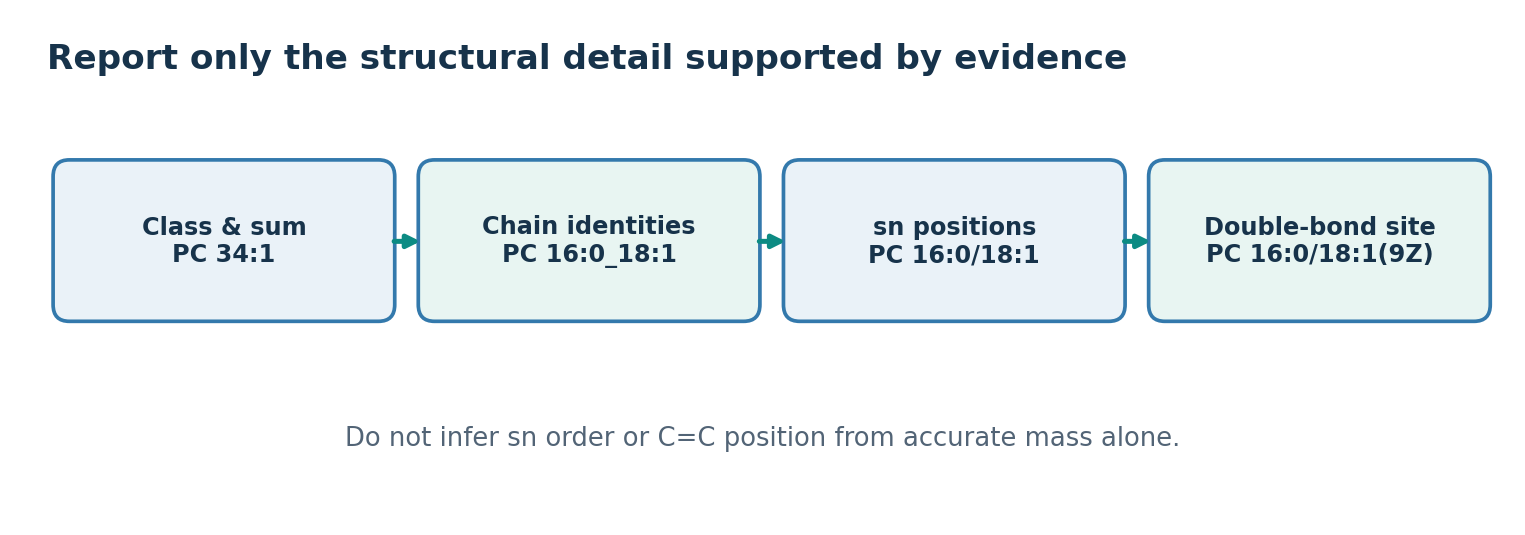
- Accurate mass narrows composition, but sn position, double bond position, geometry and stereochemistry stay unresolved without more evidence
- Structure-specific reactions, ion mobility, ozonolysis, derivatisation and standard comparison may be needed
- Structural information increases from PC 34:1 to PC 16:0_18:1 to PC 16:0/18:1 to PC 16:0/18:1(9Z)
- The rule is to name only the level actually distinguished
07
Lipidomics catalogues and explores lipids and their functions
- The lipidome is the set of lipid molecules found in a given subject and state
- Lipidomics identifies, quantifies and compares them systematically and links them to biology
- The number of lipid classes and isomers is enormous and each technique favours different lipids, so no single experiment measures everything
- LIPID MAPS uses eight categories: fatty acyls, glycerolipids, glycerophospholipids, sphingolipids, sterol lipids, prenol lipids, saccharolipids and polyketides
- Targeted analysis selectively detects and quantifies defined lipids while untargeted analysis searches broadly for differences
- Not every peak in an untargeted run is an identified lipid, and processing algorithms change the output
- A difference between groups does not make that lipid the cause of disease
- Diet, age, temperature, cell number, sampling time and instrument batch can all shift the signal
- Reproducibility, independent validation and agreement with synthesising or degrading enzymes are needed before mechanistic claims
08
Quantitation: internal standards, calibration, recovery and matrix effects
- In LC-MS peak area broadly depends on amount, but ionisation efficiency responds to structure, solvent, salts and matrix
- Ion suppression means equal amounts can give unequal signals, so peak area does not equal absolute moles
- The simplest correction is analyte area over internal standard area equals R times the mole ratio
- Assuming R equals one is a teaching simplification, and real quantitation uses calibration standards
- Example: analyte area 150,000, standard area 100,000, 2.00 nmol of standard and R of 1.00 give 3.00 nmol of analyte
- Precision describes clustering of replicates and accuracy describes closeness to a reference value
- The relative standard deviation is the sample standard deviation over the mean, times 100
- The limits of detection and quantification mark the boundaries of detection and reliable quantitation and depend on the validation approach
- A visible peak alone does not guarantee quantifiability
09
Quality control and statistical interpretation
- A blank reveals background contamination from vessels, reagents and preparation
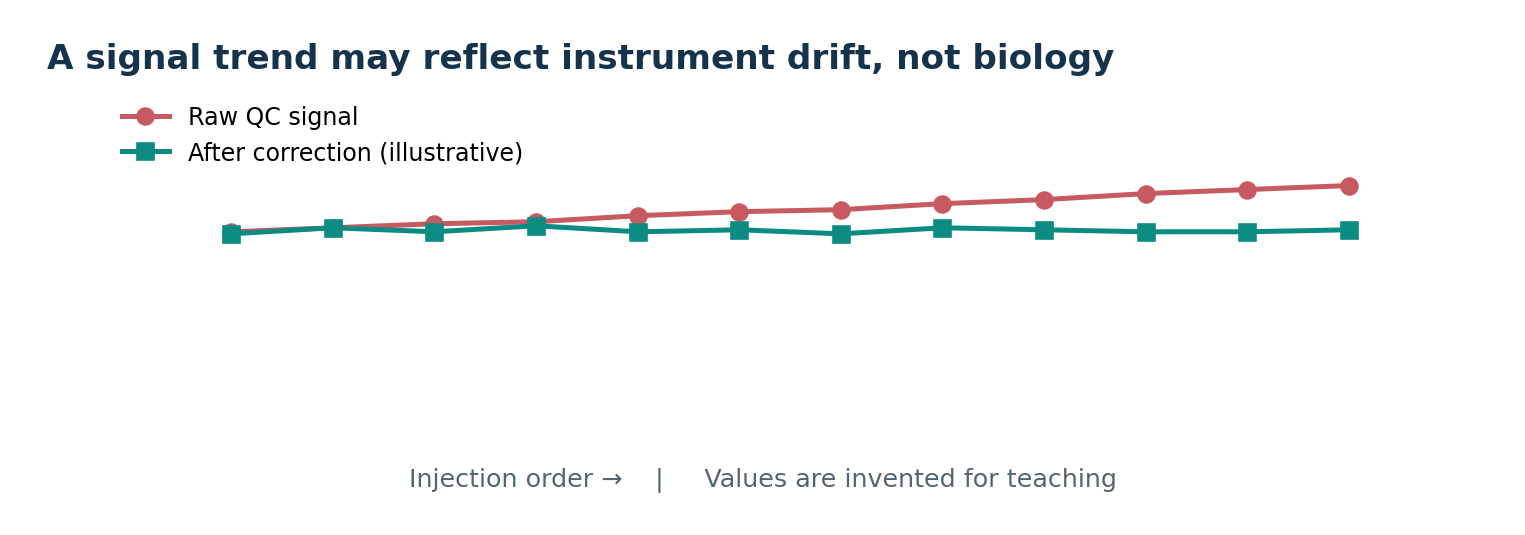
- Pooled QC mixes portions of many samples and is injected repeatedly to monitor signal stability over the run
- Internal standards, system suitability checks and randomised injection order are also core quality controls
- A uniform rise in all peaks from instrument drift must not be read as activation of a pathway
- Injection order coinciding with sample group can create a false group difference
- Comparing hundreds of lipids at p below 0.05 produces many chance findings
- Multiple-testing correction such as FDR should accompany effect size, confidence intervals, biological replicate number, distribution and detection limits
- Statistical significance does not verify a mechanism, and absence of significance does not prove absence of effect
- Example: PC 34:1 means of 100 and 140 give a 1.40-fold change and a log2 fold change near +0.485
References