01
Questions and design in carbohydrate research
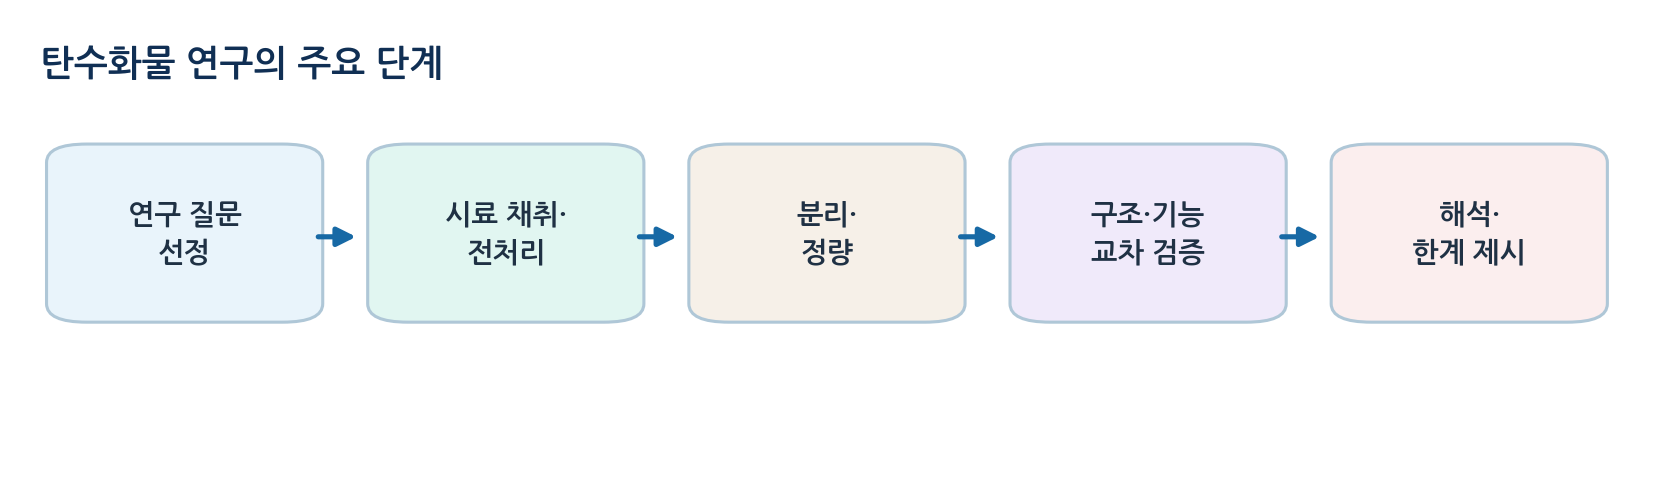
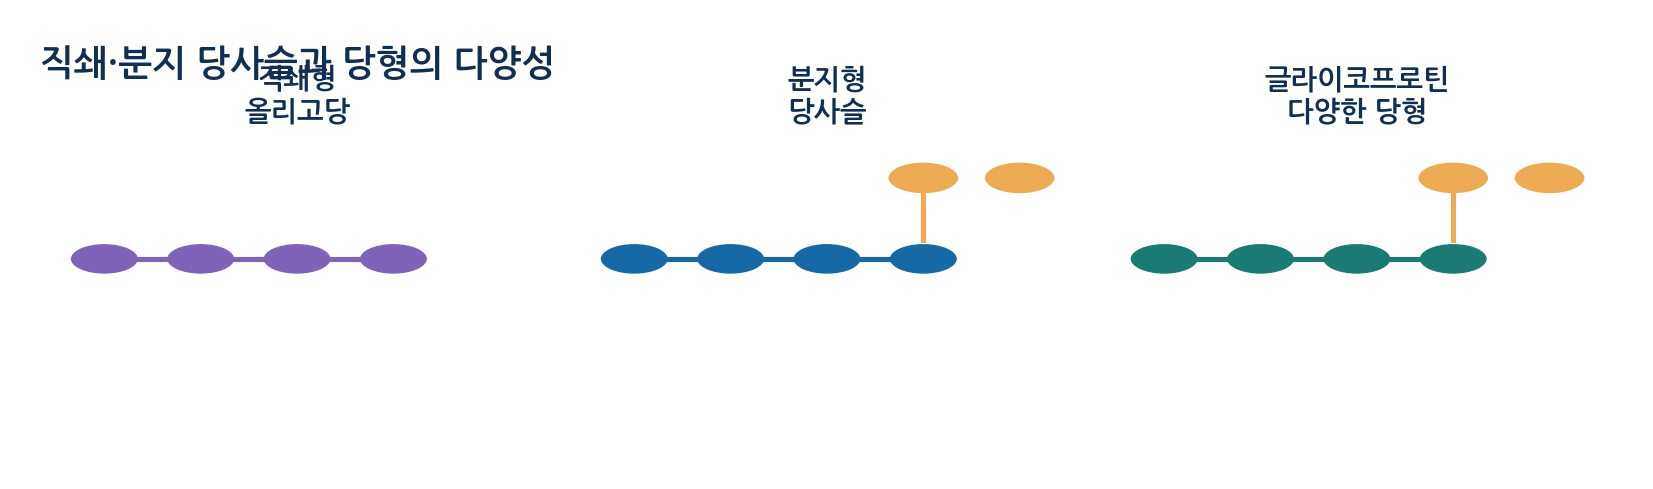
- Carbohydrates occur as monosaccharides, disaccharides, polysaccharides and protein-bound glycans, and detecting sugar does not establish concentration or linkage
- Qualitative analysis tests presence and reactivity, while quantitative analysis turns signal into amount with a calibration curve or standards
- Separation resolves components by physical and chemical properties, and structural analysis covers composition, linkage, anomeric form and branching
- Functional analysis tests biological role, and each stage supports a different scope of conclusion
- Negative controls reveal signal from reagents, instrument or solvent, and positive controls confirm that the assay works
- Blanks correct background and standards support calibration and retention comparison
02
Sampling, extraction and preparation
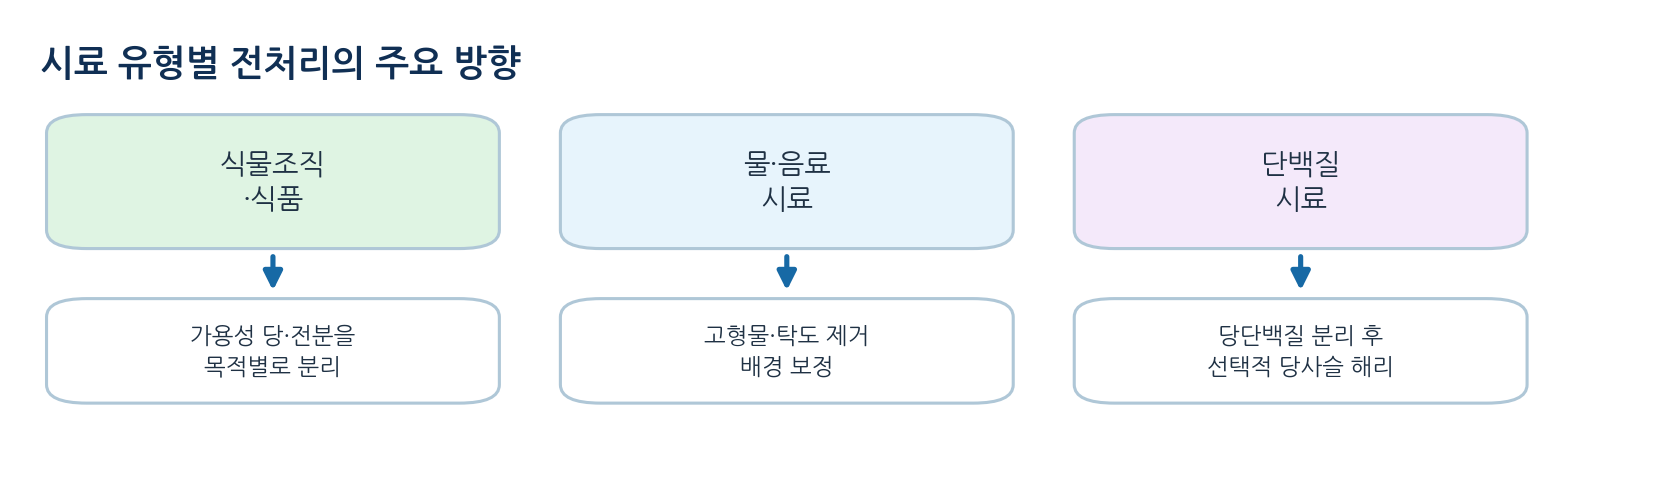
- Free sugars in beverages may need only dilution and filtration, whereas storage polysaccharides in plant tissue need homogenisation and fractionation to separate soluble sugar from insoluble starch
- N-glycan analysis requires concentration and purification of the protein followed by enzymatic release
- Acid or heat can alter original glycosidic bonds and substituents, so loss of structural information must be checked
- Sample mass, solvent volume, dilution factor, storage temperature and time to analysis are basic records
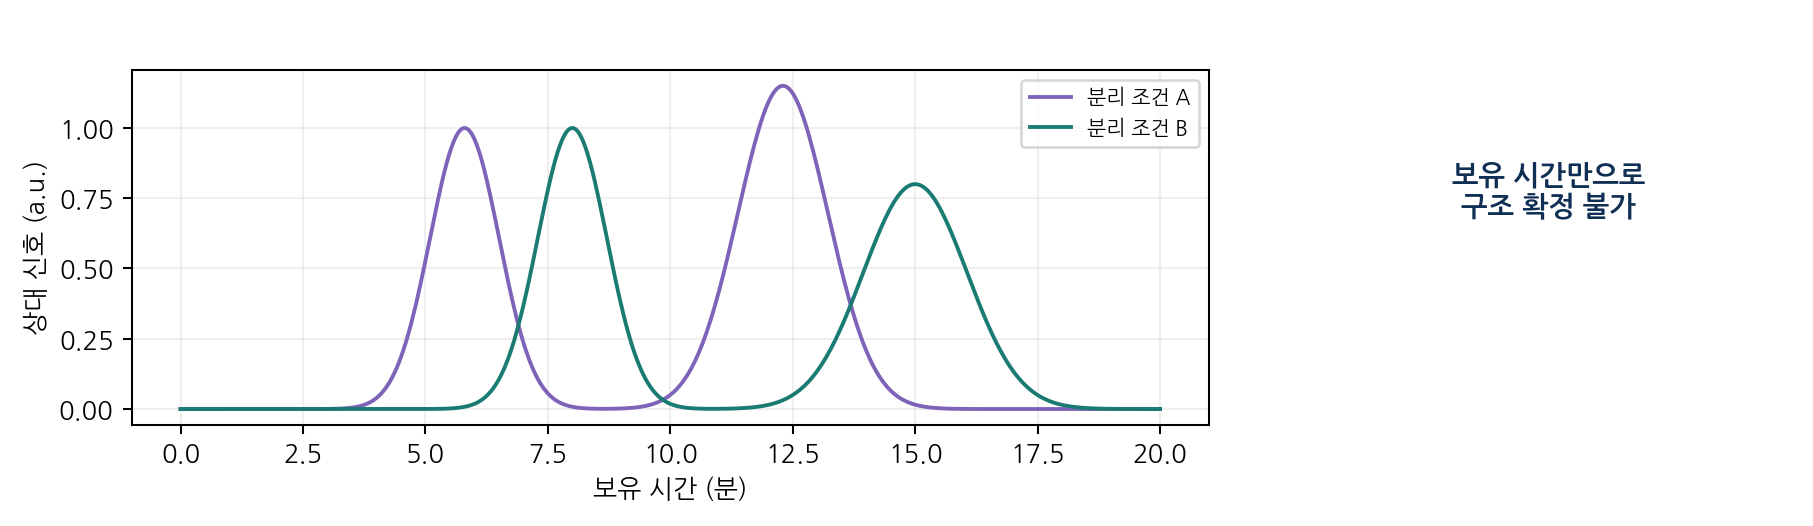
- Glycoform heterogeneity at one site means several peaks do not prove several proteins
- Conversely, several glycoforms can co-elute within one broad peak
03
Qualitative detection and selective quantitation
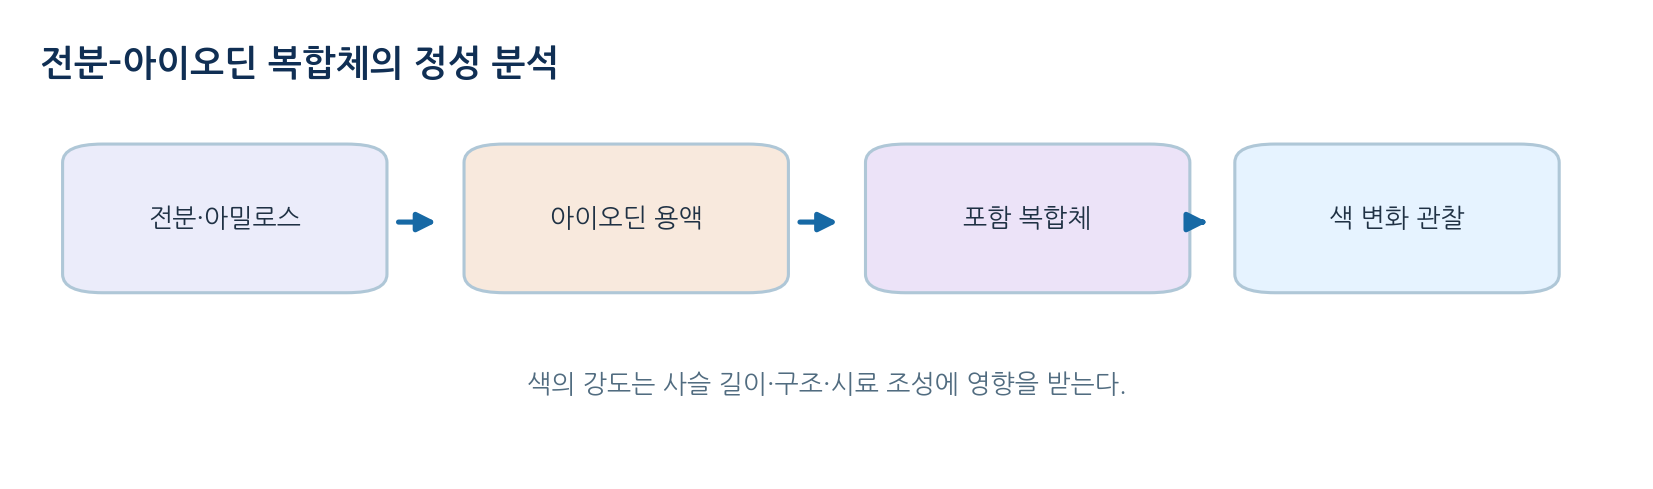
- Iodine-iodide reagent interacts with the helical structure of starch, especially amylose, to give a colour change
- Colour depends on chain length, branching, temperature and reagent concentration, so intensity cannot compare polysaccharide amounts
- Benedict reagent relies on reduction of Cu2+ by reducing sugars in alkali, and fructose can also respond, so it is not glucose-specific
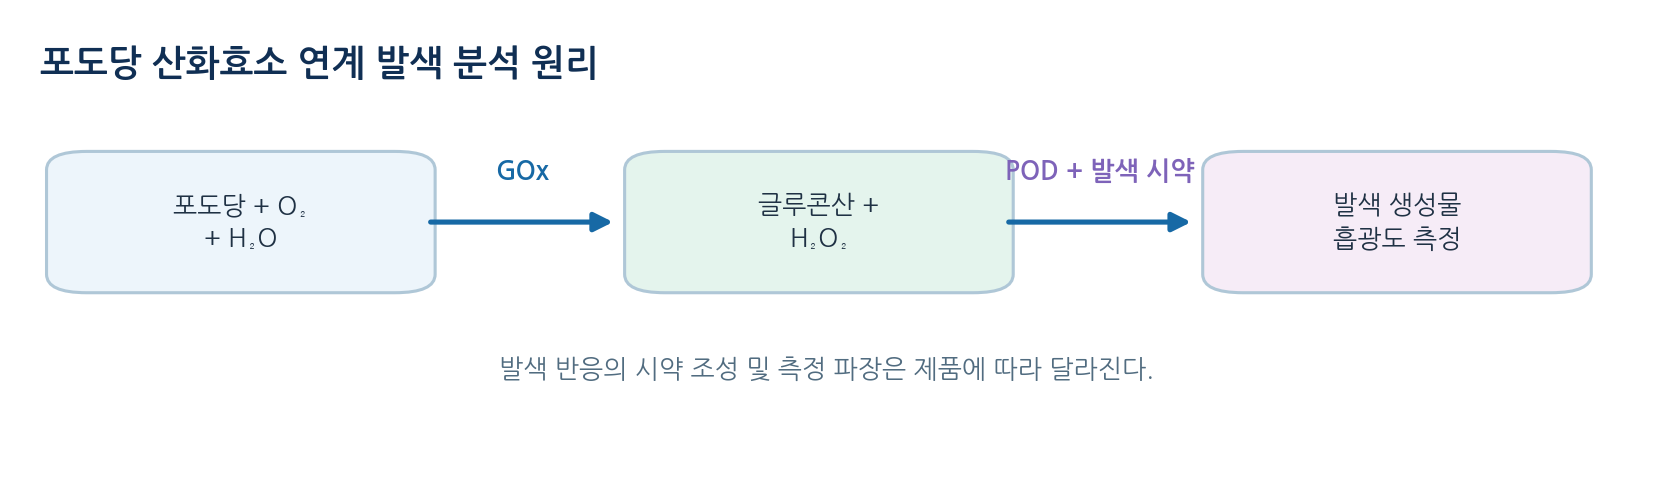
- A glucose oxidase coupled assay uses an enzyme reaction relatively selective for glucose
- Even commercial reagents need verification of interference and measuring range
04
Calibration curves, uncertainty and interpretation
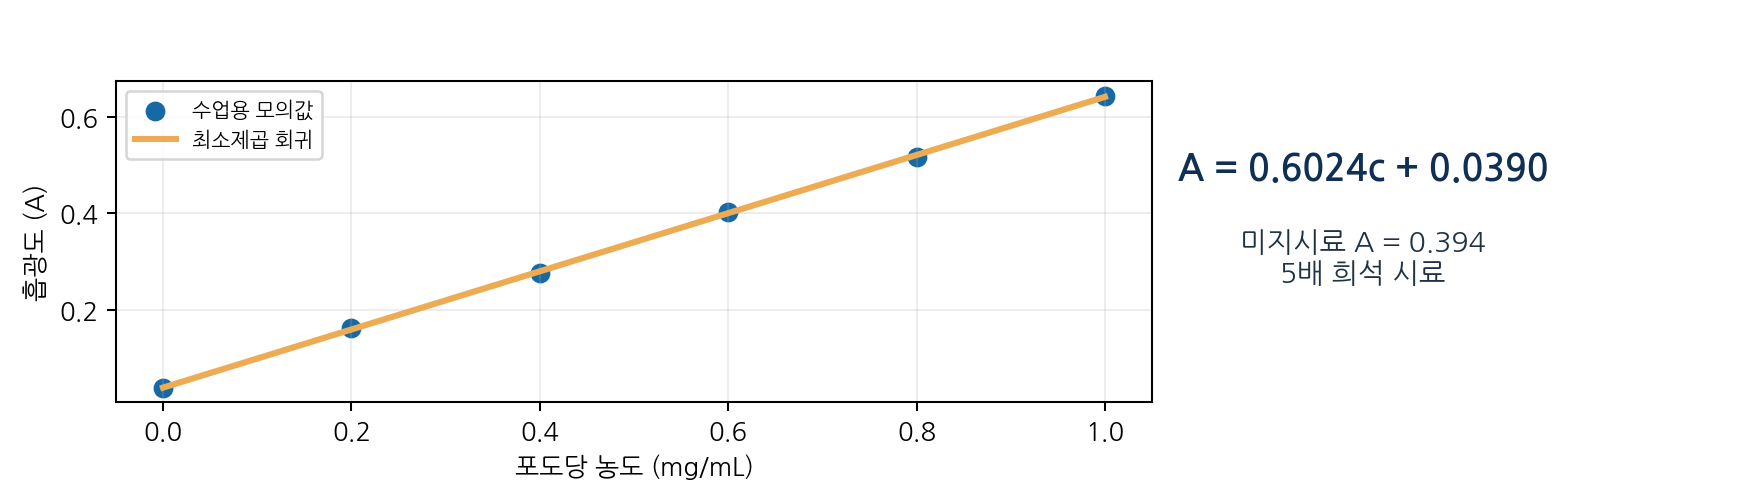
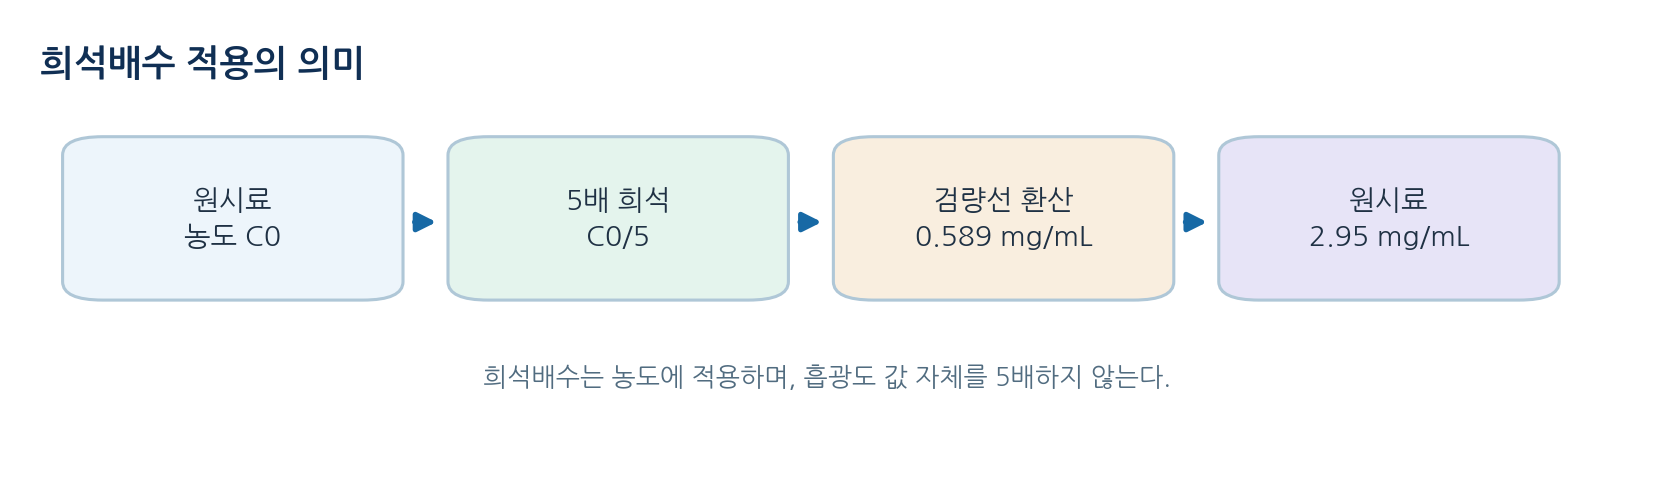
- Within the linear range use A = mc + b, and multiply by the dilution factor to recover the original concentration
- Example: with A = 0.6024c + 0.0390 in mg/mL, a fivefold diluted sample reading 0.394 gives 0.589 mg/mL and 2.95 mg/mL undiluted
- The glucose in 50.0 mL of the original is about 2.95 times 50.0, roughly 147 mg
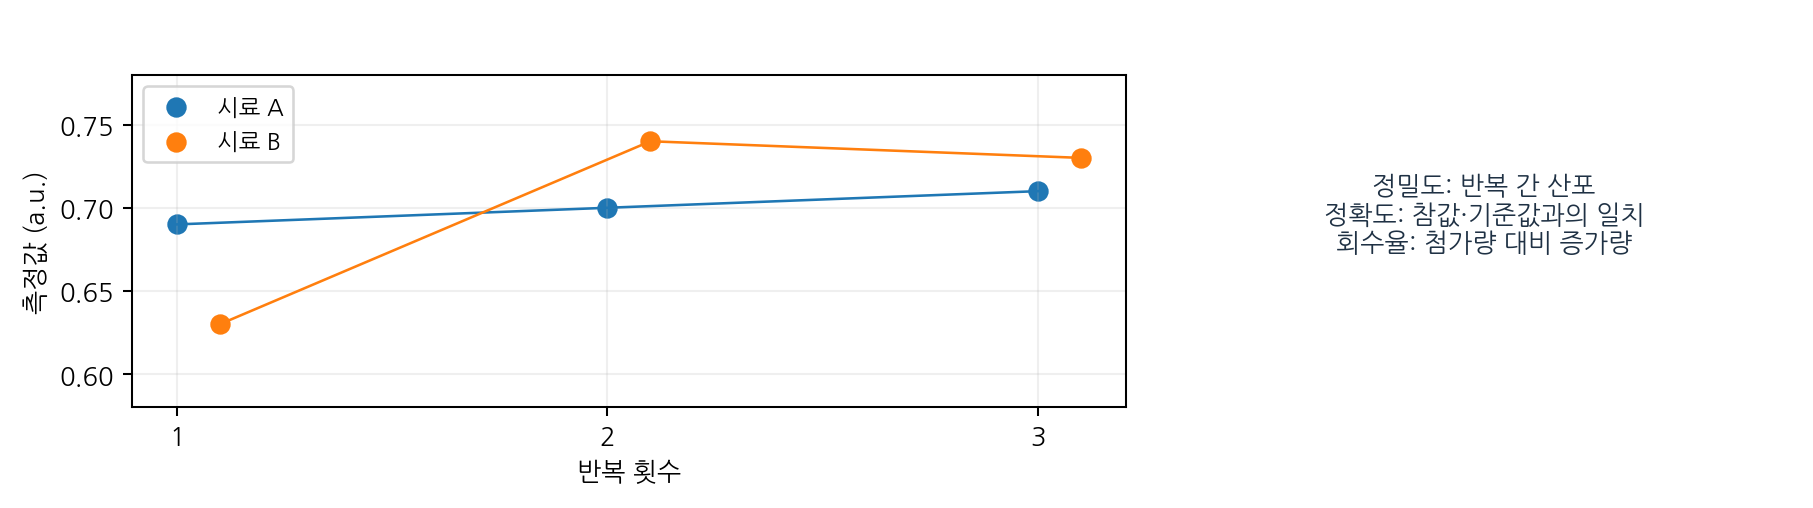
- Precision describes clustering of replicates while accuracy describes closeness to a reference and is affected by both bias and precision
- Replicates 0.68, 0.70 and 0.72 give a mean of 0.70, a sample standard deviation of 0.020 and a CV near 2.86 percent
- Spike recovery: adding 0.50 mg/mL to a 0.80 mg/mL sample and measuring 1.25 mg/mL gives 90 percent
- The limit of detection follows method performance, blank variability and regulation, not simply the lowest point on a graph
05
Separation and composition analysis
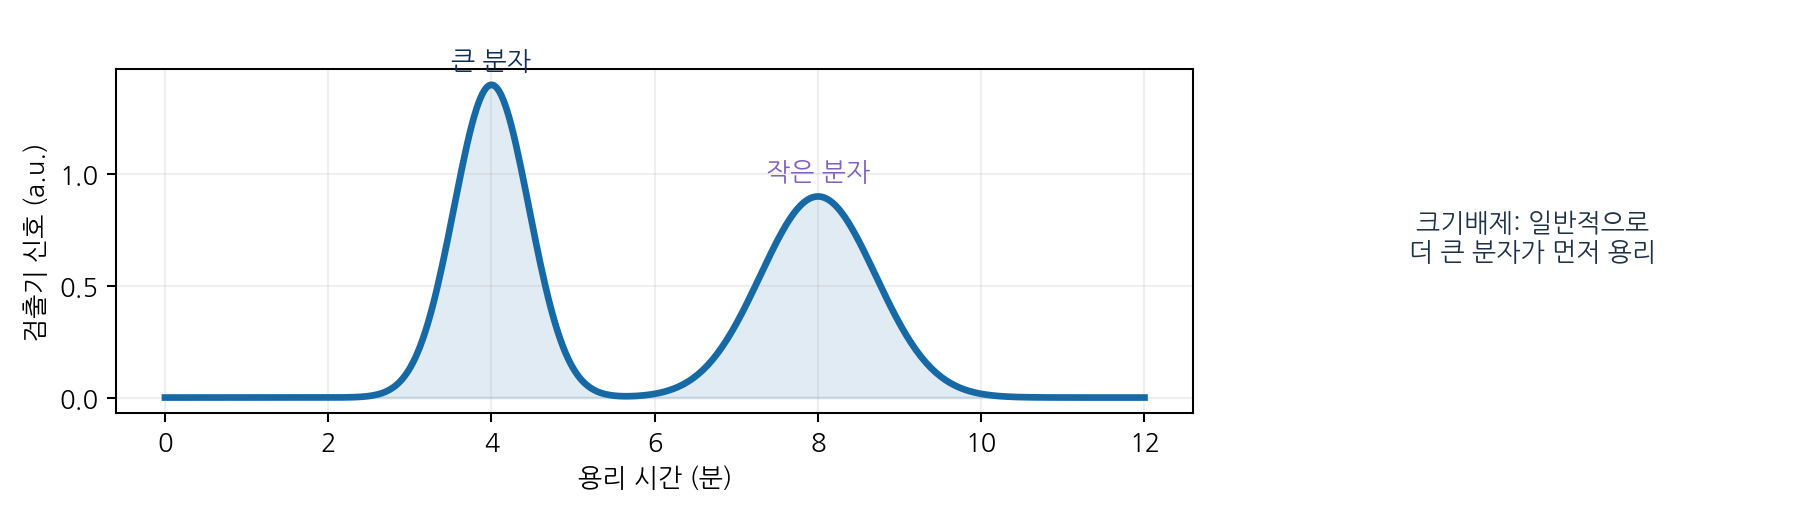
- Size-exclusion chromatography separates by access to a porous stationary phase, with larger molecules eluting earlier
- Protein binding or non-specific adsorption can change the result
- HPAEC-PAD exploits weak acid dissociation of sugars at high pH for monosaccharide and oligosaccharide composition
- HILIC and fluorescent labelling are used for hydrophilic glycan separation and sensitive detection
- Peak area ratios give mole or mass fractions only when response factors match
- Example: peaks of 1200 and 800 sum to 2000, giving relative areas of 60 and 40 percent
06
How glycan linkage structure is determined
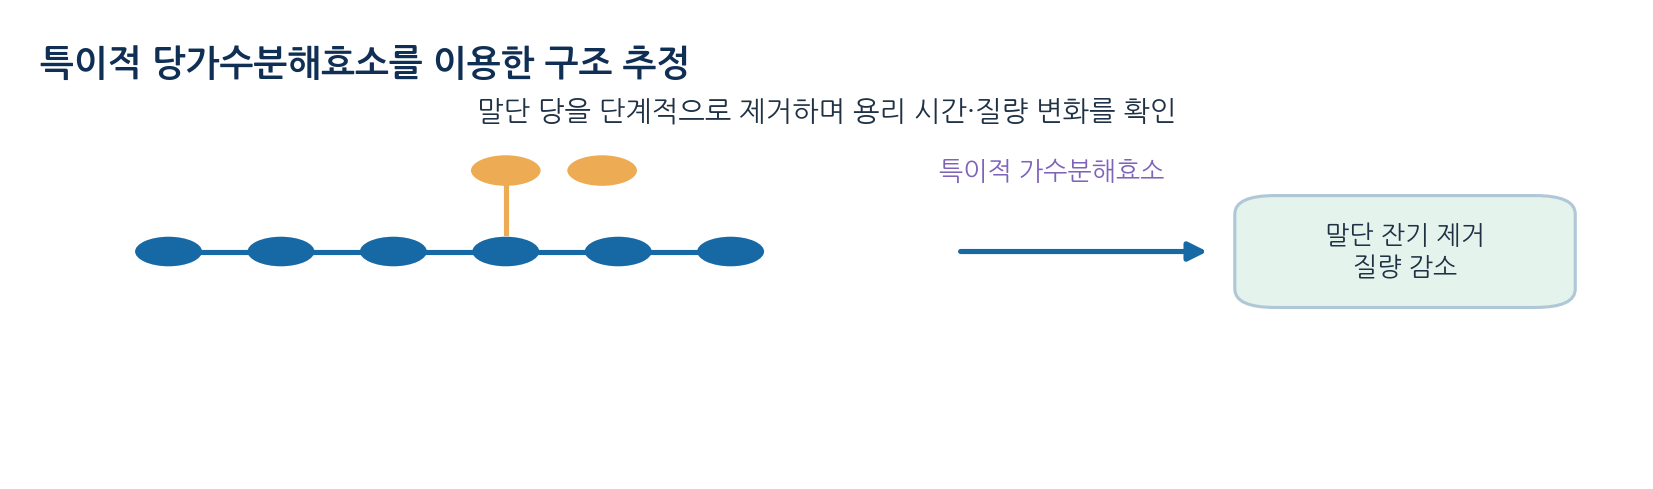
- Exoglycosidases remove terminal sugars stepwise, and mass or peak shifts before and after narrow the terminal sugar and linkage candidates
- Enzyme specificity depends on conditions, and failure to react is not evidence that a linkage is absent
- PNGase F releases many N-glycans, though core fucosylated forms are exceptions, and O-glycans need a different procedure
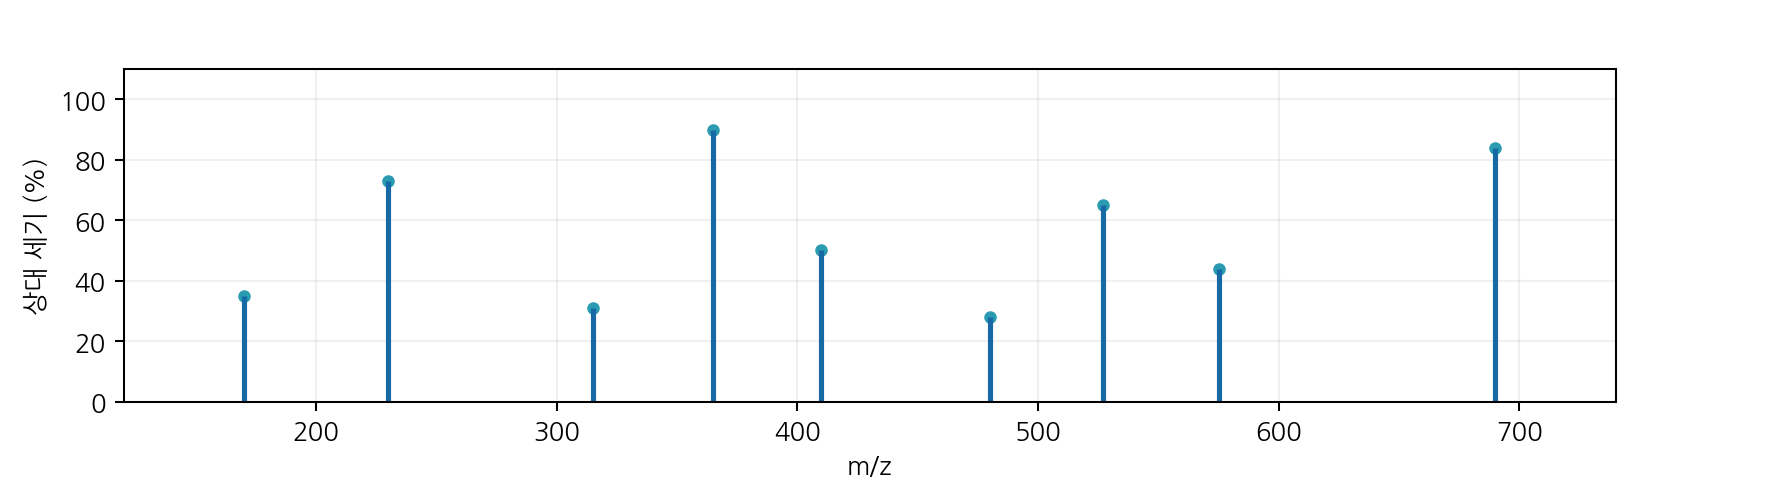
- Mass spectrometry narrows composition from accurate mass and infers order and branching from MS/MS fragments
- Structural isomers of equal mass exist, so linkage and anomeric form cannot be fixed from one spectrum
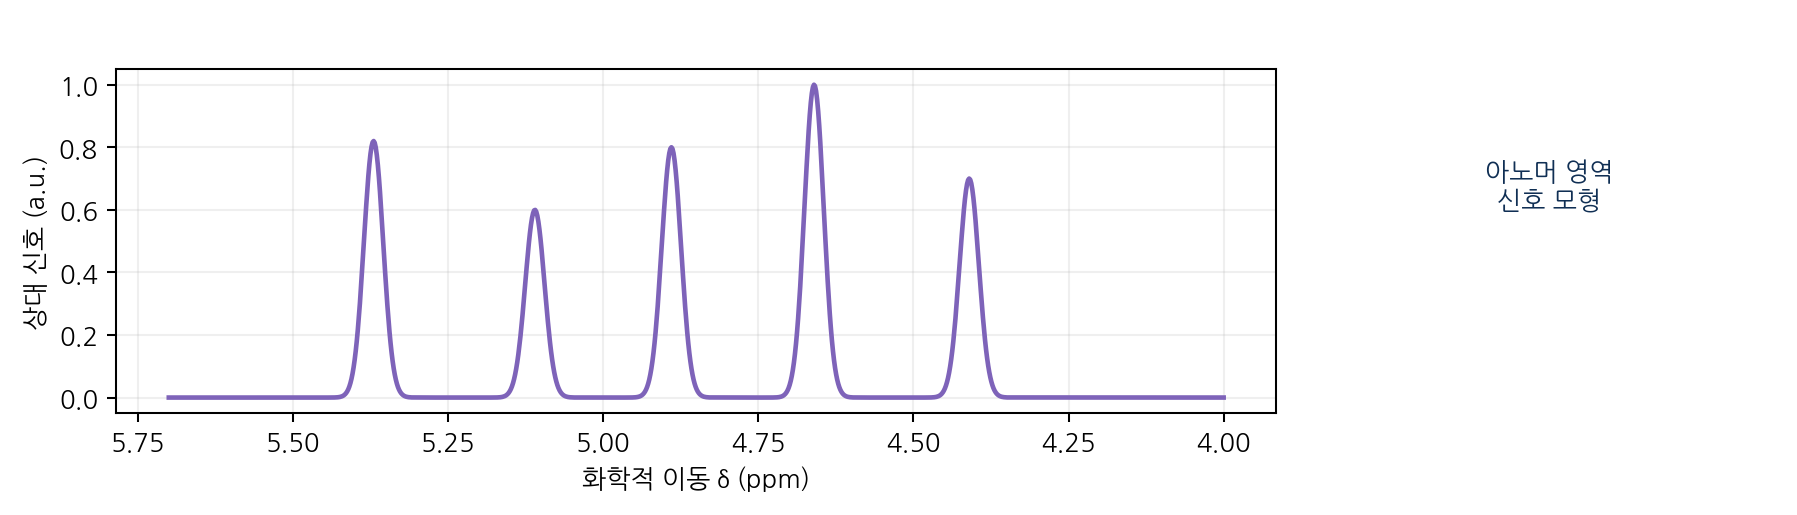
- NMR with 1H, 13C and two-dimensional methods infers ring form, anomeric configuration and linkage, though peaks overlap in complex mixtures
07
Glycomics, glycoproteomics and glycan informatics
- Glycomics surveys the composition and distribution of glycans in cells, tissues or samples
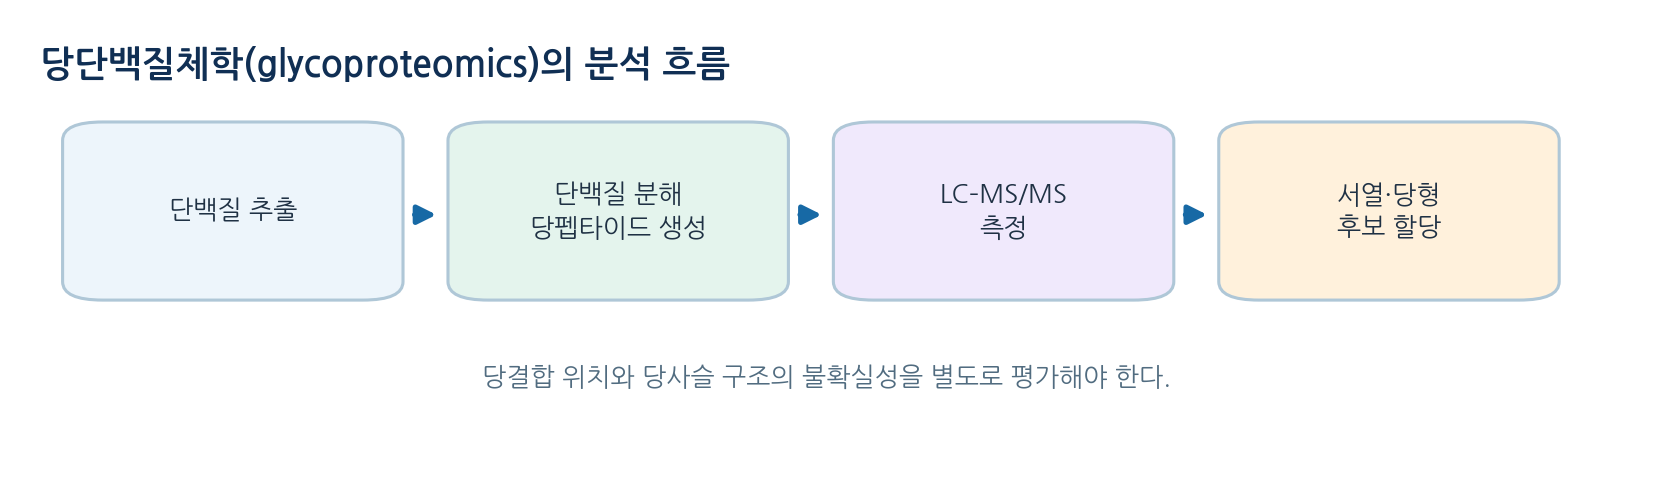
- Glycoproteomics determines which glycan occupies which site on which protein
- The two are complementary, and a changed signal alone does not identify the glycosylation enzyme responsible
- Glycan databases and SNFG allow candidate structures to be recorded in a consistent way
- Incomplete linkage data or unassigned configuration should be recorded as uncertainty
- Glycosylation analysis supports consistency of quality and function for protein medicines, and food analysis compares starch structure and process conditions
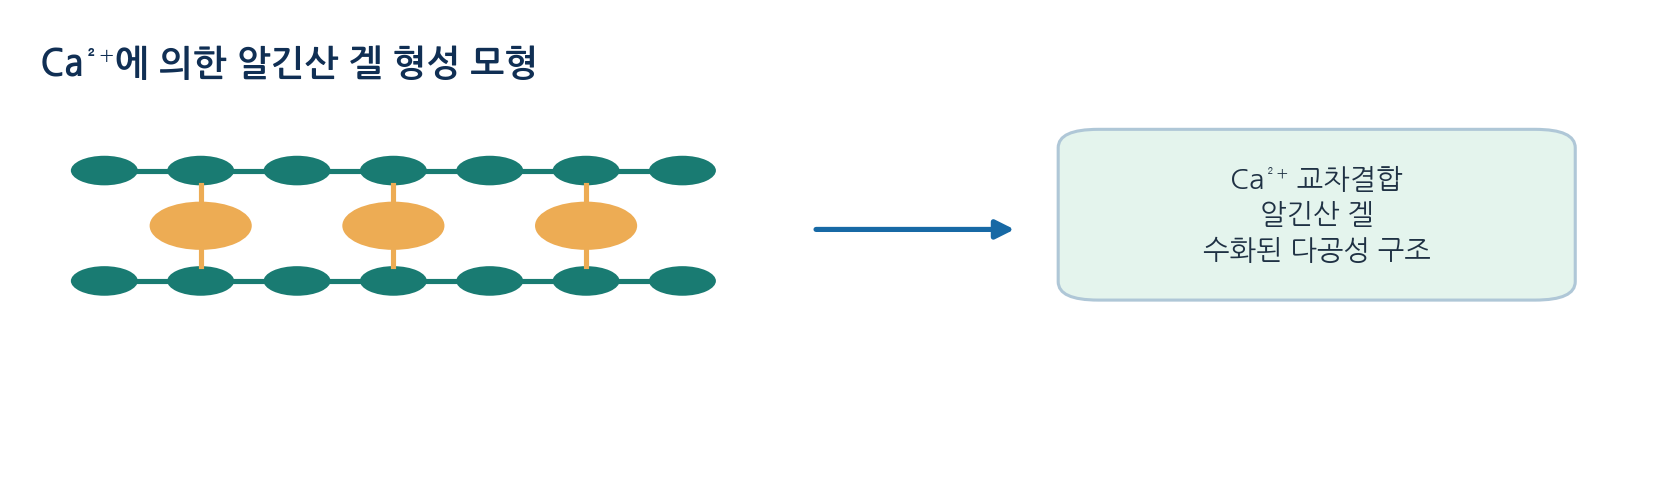
- Alginate gels are a starting point for biomaterial and food research, though strength and swelling depend on conditions
08
Limits of interpretation and choice of method
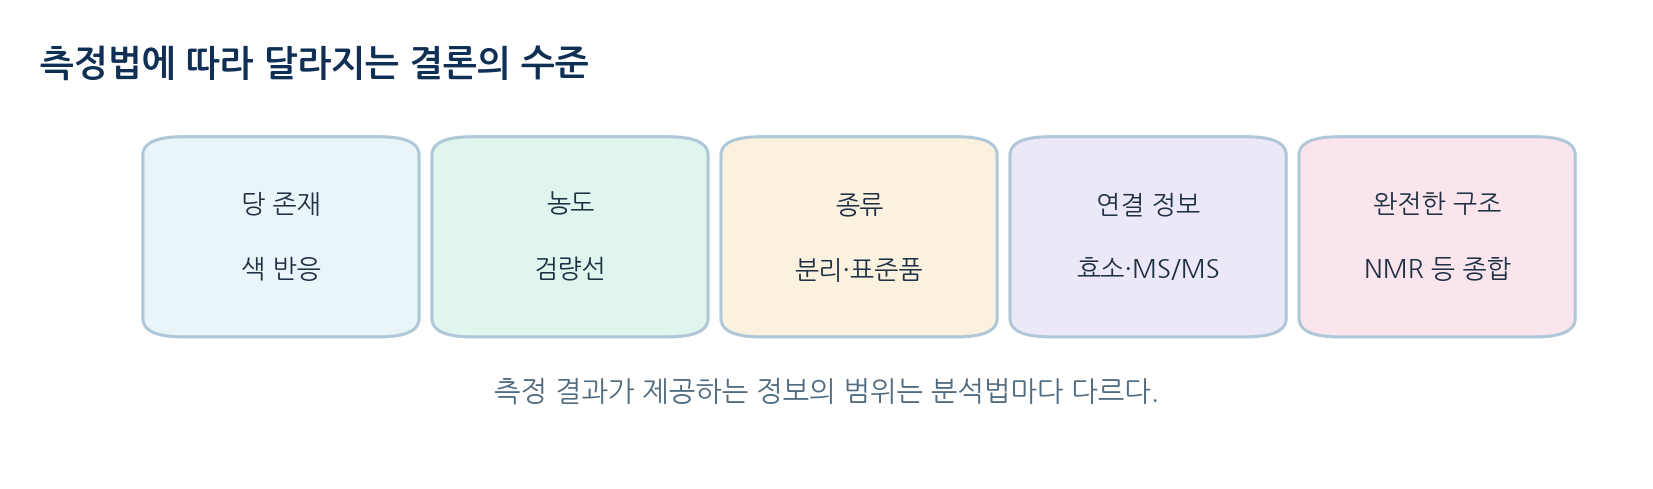
- A good report states exactly what the data support rather than displaying the largest signal
- A colour reaction suggests, separation distinguishes components, a mass spectrum proposes composition and several structural lines of evidence confirm
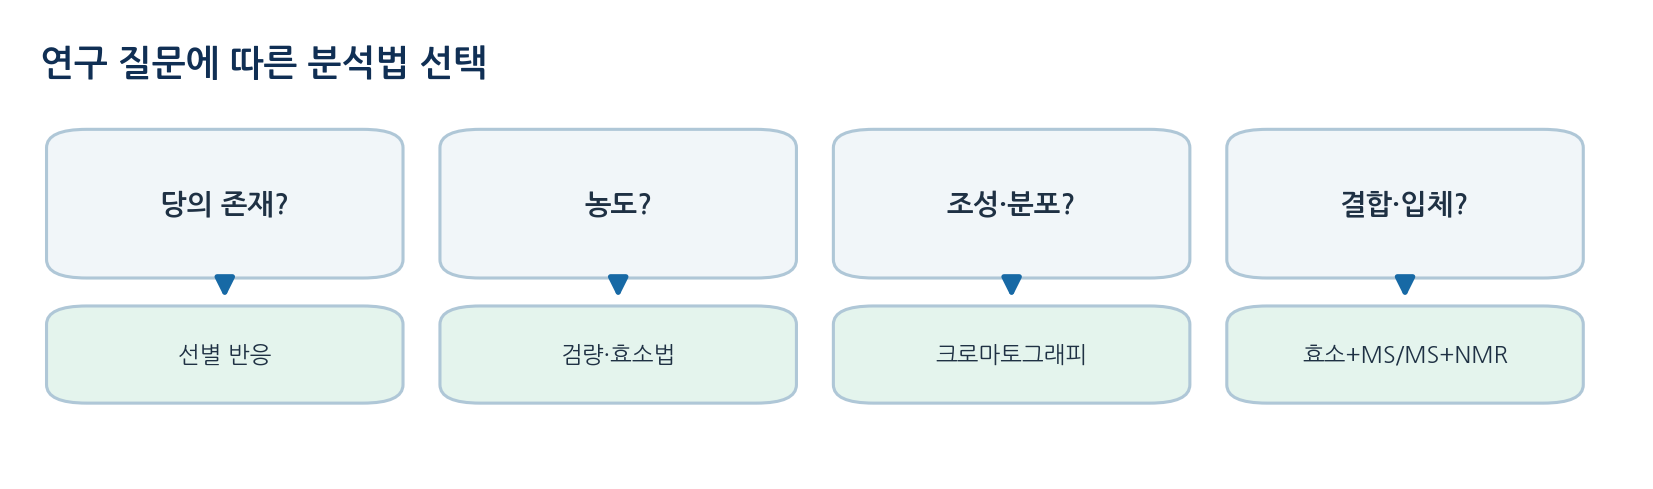
- Method choice follows the question, and error, interference and sample loss must be recorded at each step
- Matching the strength of the conclusion to the evidence of the method is the core of interpretation
References
| Question | Typical method | What can be concluded | Caution |
|---|---|---|---|
| Is sugar present? | Iodine reaction or reagent detection | Presence of a reactive component | A positive reaction does not identify a single substance |
| How much is there? | Calibration curve or enzymatic assay | Concentration of the defined analyte | Check selectivity, dilution and interference |
| How many species? | Chromatography or electrophoresis | Approximate distribution of separated components | Beware co-elution and sensitivity differences |
| What is the linkage? | Glycosidase digestion, MS/MS, NMR | Narrowing or confirmation of candidate structures | Do not decide from one method alone |
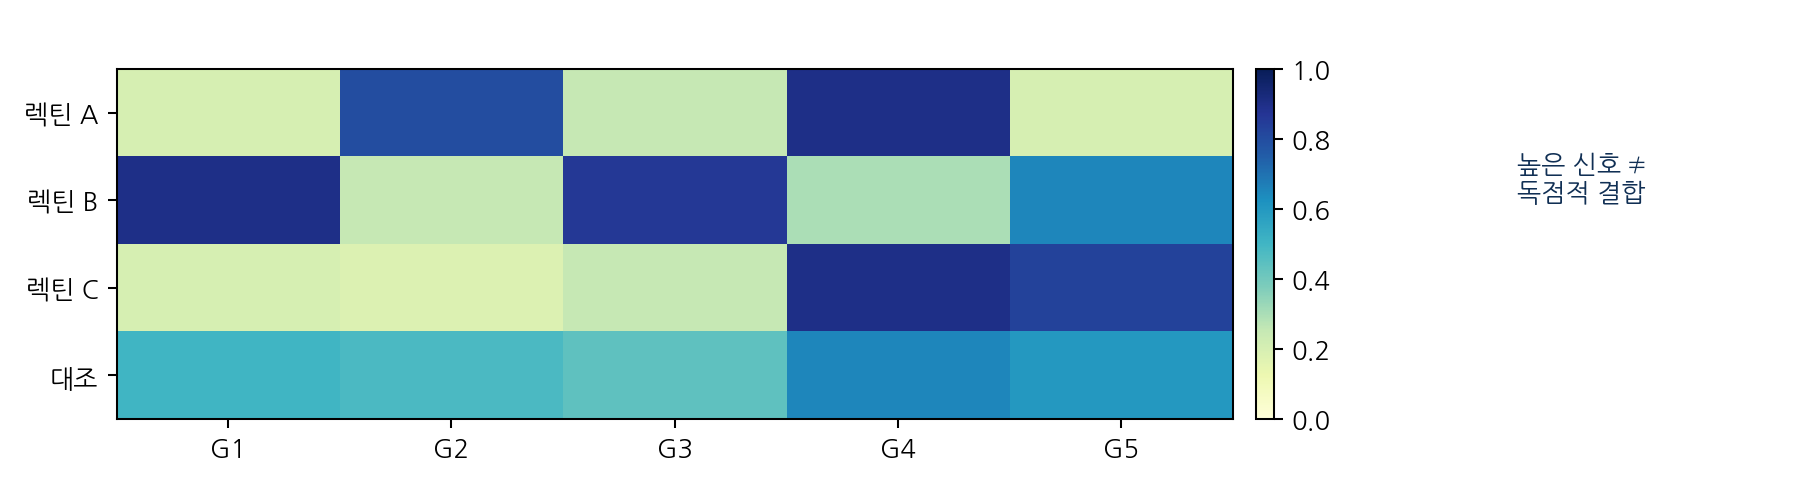
| What role does it play? | Lectin binding or functional assays | Binding or response under defined conditions | Avoid extending to whole-cell function |
| Method | Target and principle | Strength | Typical limit |
|---|---|---|---|
| Starch-iodine | Structure-dependent colour with starch | Simple qualitative detection | Sensitive to chain length and structure |
| Benedict | Cu2+ reduction by various reducing sugars | Comparison of reducing power | Cannot discriminate glucose only |
| GOx coupled assay | Colour from H2O2 produced enzymatically | Glucose selectivity and quantitation | Check reaction time, pH and interfering substances |
| HPLC or ion chromatography | Separated sugars passed to a detector | Comparison of many sugar species | Requires instrument, standards and validation |
| Method | Good for | Difficult alone |
|---|---|---|
| Glycosidase digestion | Terminal residues and specific linkages | The whole structure at unreacted positions |
| Monosaccharide composition | Identity and ratio of constituent sugars | Sequence and linkage |
| LC and HPAEC | Retention time and relative distribution | Isomers co-eluting with standards |
| Accurate mass MS | Composition candidates, mass, ion form | Isomers of identical mass |
| MS/MS | Fragment-based sequence and branch candidates | Complete assignment of every configuration |
| NMR | Linkage, anomeric form, local environment | Complete structure in complex or trace samples |